TABLE OF CONTENTS
- Introduction
- Signing in to the Desktop Client
- The elements of the form
- Tab #1: Data Transfer Actions - where transfers are executed
- Tab #2: IEA Test Actions - where sample tests data gets uploaded
- Tab #3: Connectors - where you test and persist a connector
- Setting up logging on local machine (for "forensic data")
Introduction
The IDE Desktop client is used to manually execute (scheduled) uploads or downloads. More specifically it is necessary to use when the IEA is using a Connector in either sending or receiving "end" having its so called "Executing Component" set to "Desktop":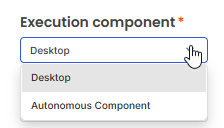
In case that "Autonomous Component" is selected here, the Desktop client will not manage any such transfers, and they will not show up in the list of "Data Transfer Actions". Instead these transfers will be executed "automatically" using the tenant's installed Autonomous Component.
Signing in to the Desktop Client
If you have not installed the Desktop client on your local machine, here is article describing this.
When Desktop client is started, you first need to sign in using your work business account:

Excerpt of form for logging in to the Desktop client.
The elements of the form
The form you see when you have signed in contains 3 tabs (1, 2, 3) as well as a grid listing all the transfers that you can effectuate (by pressing Action button at 14 - Upload or Download).

The "map" of the items on the Desktop client, explained in detail below (and some have their own chapters):
| Item | Description |
| 1 | Tab showing a grid with all the "Transfer Actions" that you can effectuate, by pressing the button in the "Action" column. See chapter later in this document for details. |
| 2 | On rare occasions, you may want to have sample data from a real (partial) upload. Here, you can execute such as sample upload. See chapter later in this document for details. |
| 3 | Tab showing grid with all the Connectors. For each you can press the "Test" and "Persist" buttons. See chapter later in this document for details. |
| 4 | Search box for limiting the rows in the grid. |
| 5 | Button for refreshing data shown in grid (e.g. after you have pressed "Generate transfer event now" in the web page for IEA setup). |
| Columns in the grid | |
| 6 | Select row. |
| 7 | Status: Overdue, Failed. |
| 8 | Data Transfer Id - auto generated number of increasing value. |
| 9 | IEAId - A hyperlink to open the webpage where the IEA is defined. |
| 10 | IEA Title - the title of the IEA. |
| 11 | From / To - the tenant expected execute the upload or download. |
| 12 | Transfer window start: The earliest time the transfer can be uploaded. |
| 13 | Transfer window end: The latest time the transfer can be downloaded without being considered "Overdue". |
| 14 | Action: Button to execute "Upload" or "Download" - action. |
| Other controls in form | |
| 15 | Open form for setting up logging of API traffic to local folder. More info in later chapter of article. |
| 16 | When pressing this, you will see these options: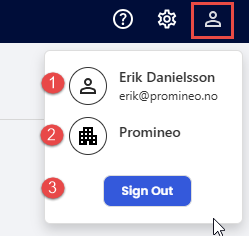 1. See which user you are logged in as. 2. Click on icon to see details of the Tenant you belong to.3. Click to sign out of the application. |
Tab #1: Data Transfer Actions - where transfers are executed
Tab showing a grid with all the "Transfer Actions" that you can effectuate, by pressing the button in the "Action" column. This button will either have the text "Upload" or "Download", and once the button is pressed a log window will open showing the details of the upload or download process. If upload or download is unsuccessful, you will be given an error message that hopefully indicates the cause of the problem - and if you are able to correct the problem, you can press the button again to continue (re-try) the process.
Which events are seen in list?
It is important to know that only ONE row can be shown for an IEA, and the "representative" will always be the event closest to today - in either direction.
Example to illustrate an "edge" case for above topic:
You have an IEA with a Weekly frequency set to Wednesday a 16:00. Today is Monday 16:00
You press "Generate transfer event now" on the IEA webpage for the IEA.
The Desktop client will then moments later show the event that was just generated, since it is closer to today than Wednesday 16:00. But when time comes to Tuesday 16:01 "Wednesday at 16:00" will be closer in time and hence that event will be the one shown in grid.
Skipping an even from the list
In case you (for whatever reason) want to skip an event (upload or download), you can right-click on any row to see this submenu: Skip: Will skip the upload or download event (in case upload is skipped the related download event will also be skipped).
View IEA: Open the web page showing the properties for the related IEA.
Tab #2: IEA Test Actions - where sample tests data gets uploaded
A few words of background before getting into the details:
There is a utility for testing Configs using randomized data. This is the recommended way to "debug" and test your Config mapping formulas. On the rare occasions, however, where you (for whatever reason) want to upload an excerpt (50 first rows that passes the upload filter) of "real sample data" from your source, you can press this option in the web page for the IEA: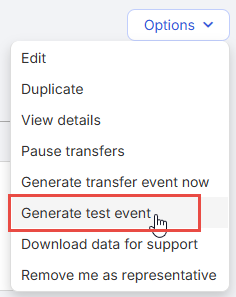
... and then press the resulting "Upload"-button in the Desktop:
 Screenshot showing upload button that is "generated" by IEA web page menu called: "Generate test event".
When returning to the IEA web page, you will see a new tab called "IEA tests", where the uploaded data is shown and (in "Test Comparison" tab) compared against the download mapping formulas to confirm their effect:
The uploaded data can be seen, as a new tab appears in web page for IEA called "IEA tests":
Tab #3: Connectors - where you test and persist a connector
Tab showing a grid with all Connectors: By pressing "Test", you can verify that the Connector can successfully establish a connection to the host system.
By pressing "Persist", you will load a list of all schedules in host system targeted by the Connector, as well as the user field settings found there.
Setting up logging on local machine (for "forensic data")
If something "goes wrong" with a transfer, the support personnel need to understand what data was transferred in order to understand the "unexpected" situation leading to an "error", as well as all the settings in the IEA. In order to have these available, the local user needs to turn on the logging in dialog as seen below, and opened by pressing the "cogwheel" at top right of application:
 This form will be seen:
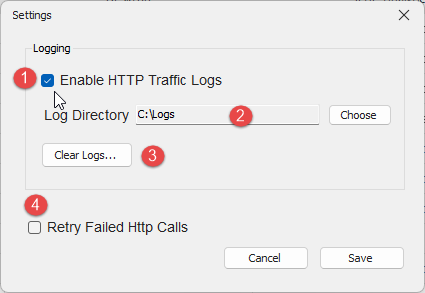
Screenshot for setting up user options for logging. Numbered items are described in table below.
| Item | Description |
| 1 | Enable HTTP Traffic for logs. Default checked. |
| 2 | The path to the local folder where local log files are stored (need to be a private area for user only as the log data should not be shared). |
| 3 | Button to clear all folders under the log folder (see 2 above). |
| 4 | Controls if request should be re-tried if there is non-successful response either from API or Host System servers. Default "unchecked". |
In this article you can learn more about the log files and what the contain.
Was this article helpful?
That’s Great!
Thank you for your feedback
Sorry! We couldn't be helpful
Thank you for your feedback
Feedback sent
We appreciate your effort and will try to fix the article