Table of contents
Introduction
This article helps you understand how to obtain the detailed API logs from sender to receiver, in order to see all the "facts" and understand why things may deviate from your expectations during a transfer.
Step 1: Request and upload of the logs
The screenshot below
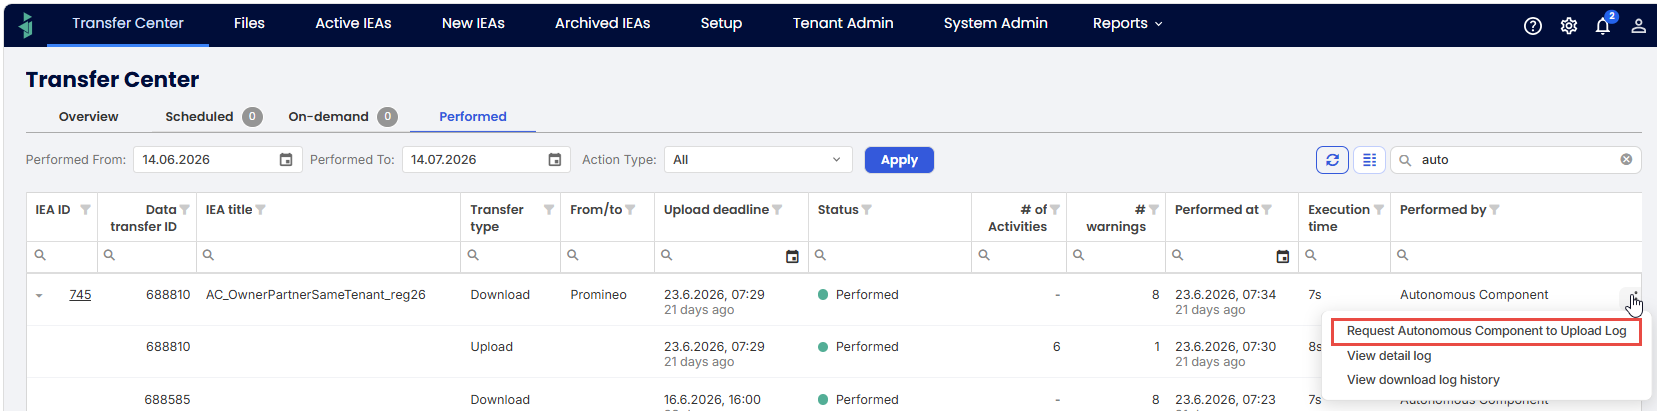
Step 2: Download the logs
The logs are only available for the Tenant that owns the schedule, as well as the "support Tenant" (the Tenant responsible for support: Promineo AS).
They will be able to see a menu choice in the System Admin menu:

When pressing the button, you will see this list:
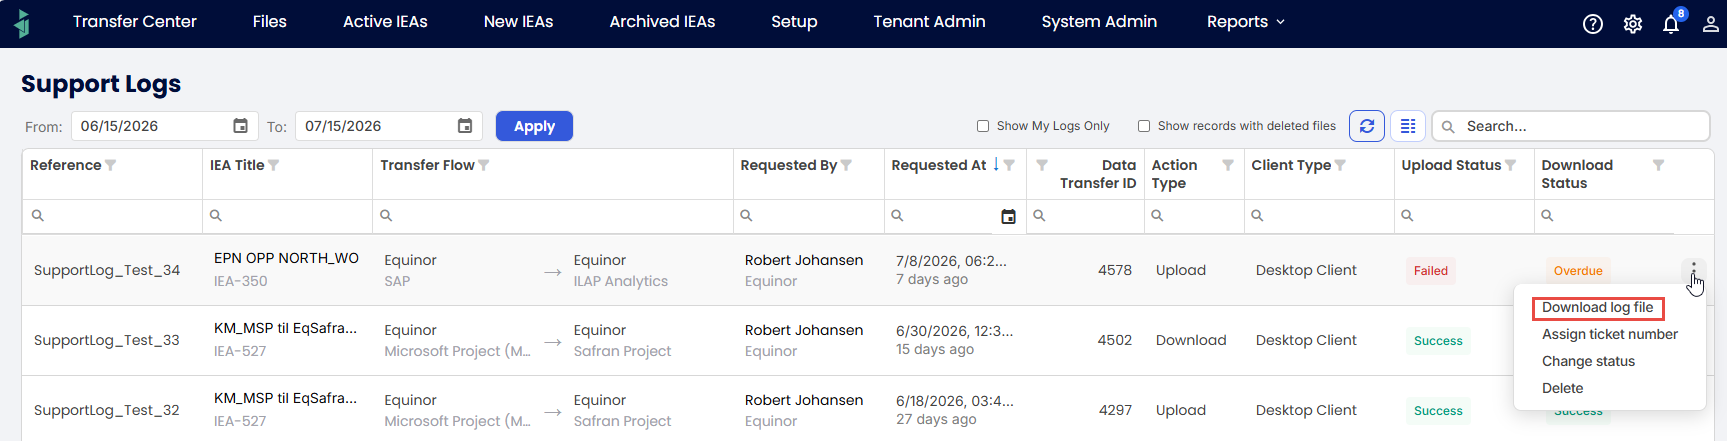
list of support logs to download using "3-dot menu" seen above.
By pressing the "3-dot menu" called "Download log file", you will receive a zip file in your download directory (example here):

By double clicking on it you will see the top-folder for the logs:

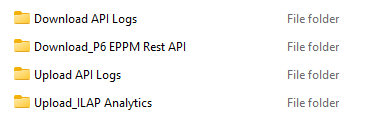
And by double clicking this folder, you will see the folders for upload and/or download (you see both , and in this example, only if you are sender and receiver):
Each of the folders will contain multiple .json files that require a bit of technical know-how to interpret (and is not part of the scope of this article):
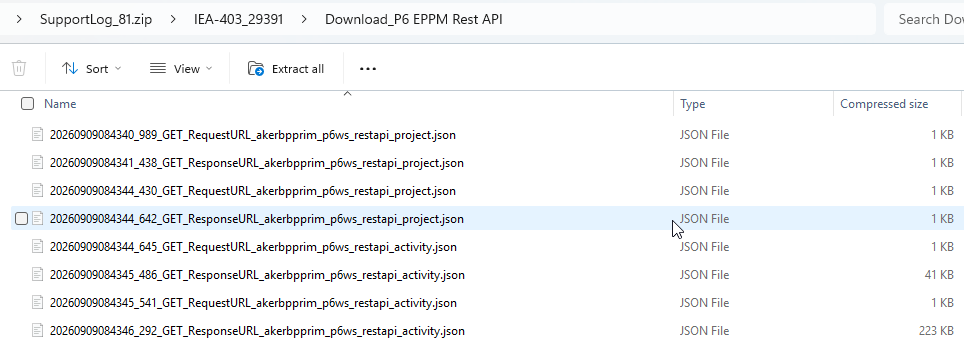
List of files in one of the support log folders (here showing log traffic to/from P6).
Was this article helpful?
That’s Great!
Thank you for your feedback
Sorry! We couldn't be helpful
Thank you for your feedback
Feedback sent
We appreciate your effort and will try to fix the article