TABLE OF CONTENTS
- Introduction
- Who can see it, and how to open it
- The four summary cards
- Data Transfer Jobs
- Poll History (last 48 hours)
- Connectors
- How to read the colors and badges
- Refreshing and filtering
- Using the dashboard to troubleshoot
- Related guides
Introduction
The Autonomous Component Dashboard is a single live screen that shows you how your organization's Autonomous Component is doing — whether it is running, what transfers it is working on, what it has finished or failed, how recently it checked in with SchedEx, and whether each of its connectors is healthy. It is where a Tenant Admin goes to answer "is our automated transfer engine working, and what is it doing right now?" without having to open each transfer one by one.
This guide explains every panel on the dashboard and how to read it. It does not cover changing how transfers run — for that, see Controlling transfers for the Autonomous Component.
Who can see it, and how to open it
The dashboard is a Tenant Admin screen. Regular users, Setup Admins and System Admins do not see it — a System Admin has the separate Deployment Center instead.
Open it from the Tenant Admin area, under Clients → Autonomous Component → Dashboard. It always shows the Autonomous Component for your own tenant.
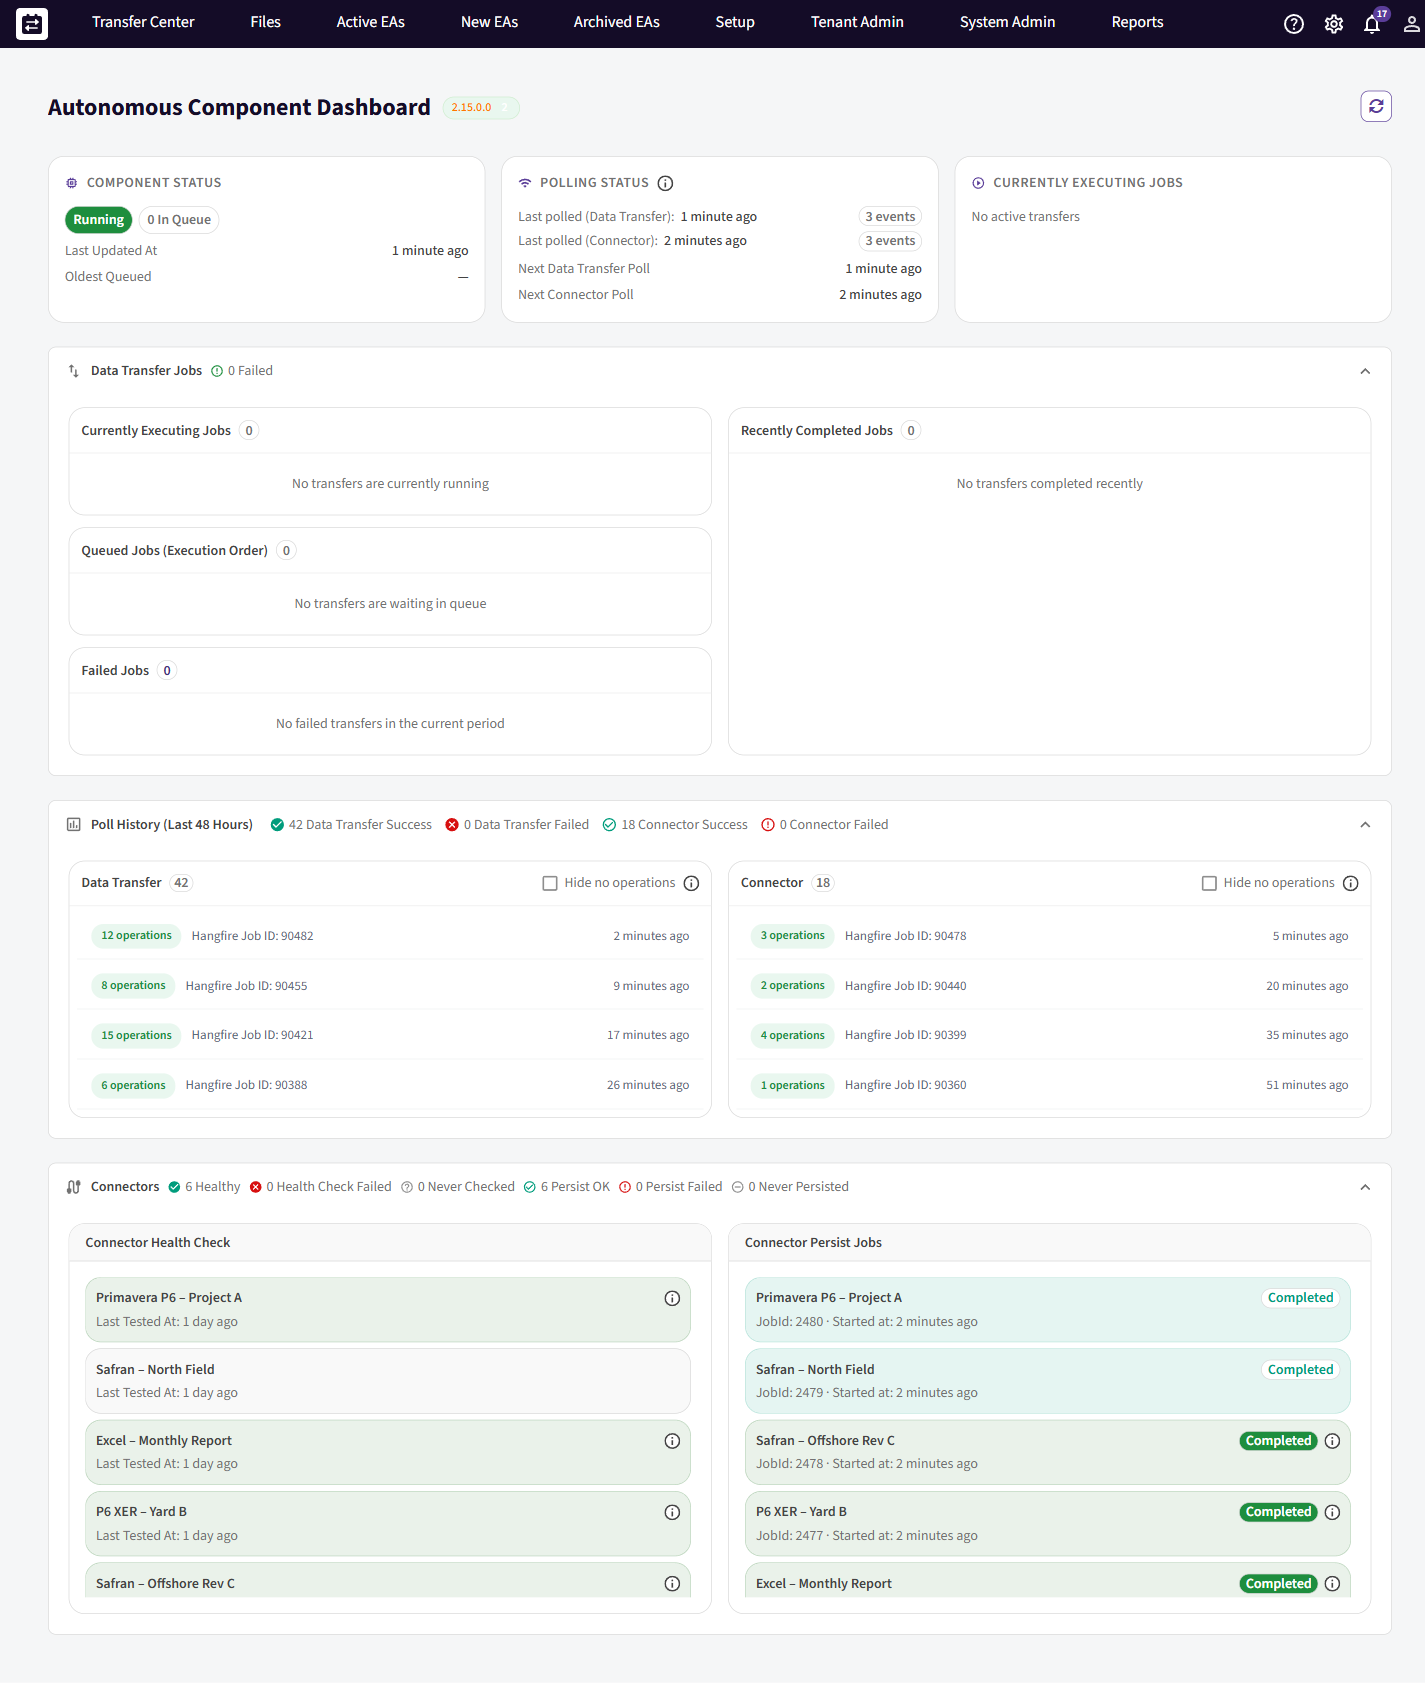
The page is live: open it and it reflects the current state. Use the Refresh button in the top right to pull the latest (see Refreshing and filtering).
The four summary cards
Across the top are four cards that give you the headline answer at a glance.
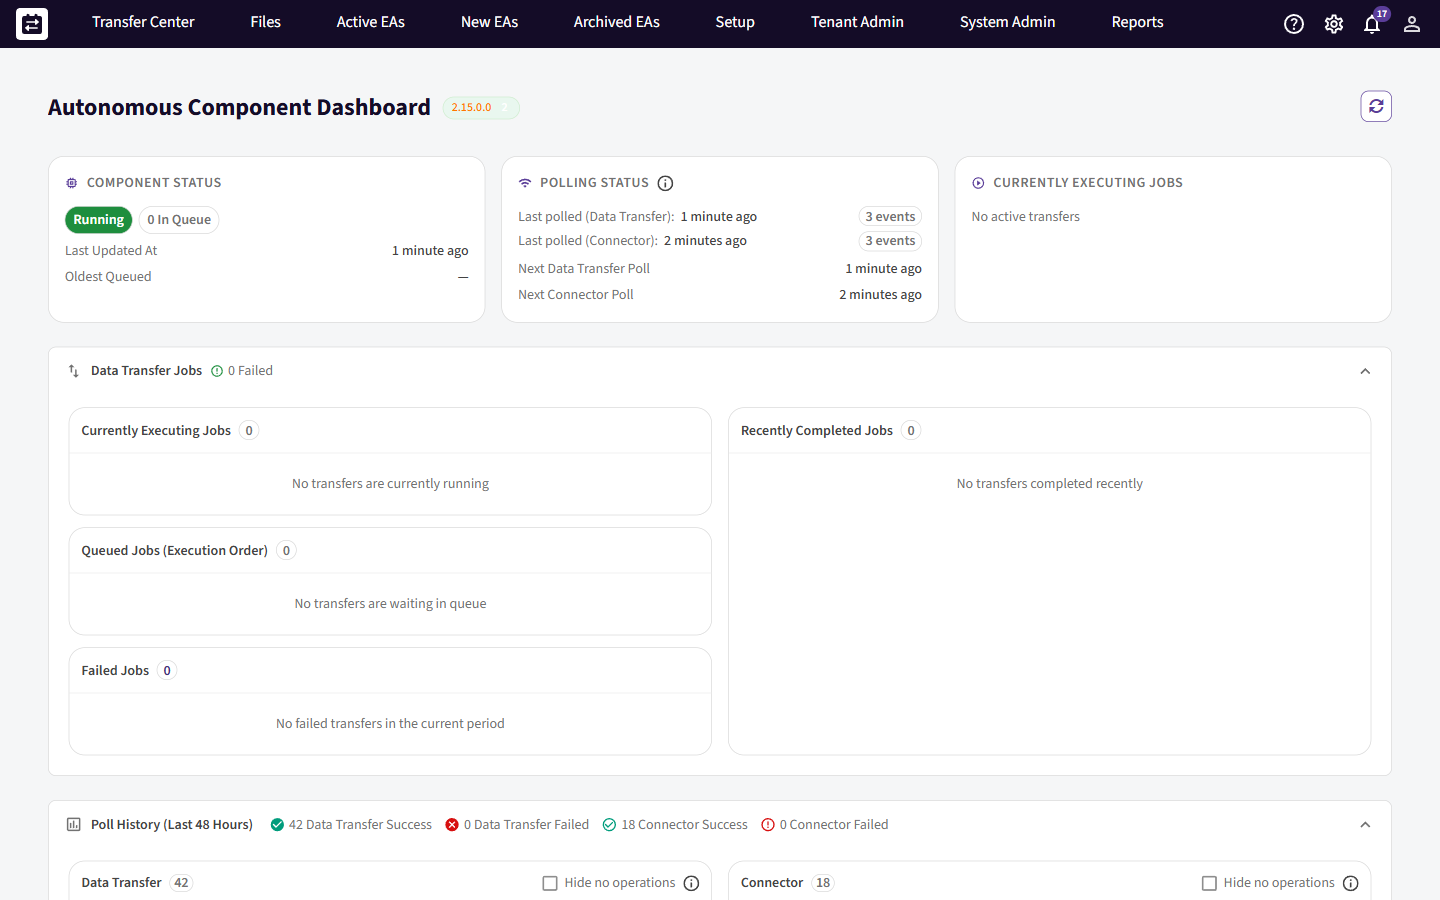
Component Status
Tells you whether the component is alive and how much work is waiting.
- A coloured state badge (for example Running, or Offline).
- {n} In Queue — how many jobs are waiting to run.
- Last Updated At — when the component last checked in (its heartbeat). A recent time means it is alive; a stale time is the first sign something is wrong.
- Oldest Queued — the age of the longest-waiting job, so you can spot a backlog.
Polling Status
The Autonomous Component works by polling SchedEx — regularly asking "is there anything to do?". This card shows those check-ins:
- Last polled (Data Transfer) — when it last asked for transfers to run, with how many it picked up.
- Last polled (Connector) — when it last asked for connector work, with how many it picked up.
- Next Data Transfer Poll and Next Connector Poll — when the next checks are due.
If "last polled" is recent, the component is talking to SchedEx normally.
Currently Executing Jobs
- A {n} Executing badge — how many transfers are running right now.
- For a running transfer it shows the Data transfer ID, when it Started, and the Elapsed time.
- When nothing is running it shows No active transfers.
Version
Top-right of the page, a version badge shows the component's version and whether it is up to date, behind, or incompatible with the platform. Keep it green; an incompatible component can stop transfers.
Data Transfer Jobs
This panel is the detail behind the summary — every transfer the component is running, waiting on, has failed, or has recently completed. The panel header carries running totals: {n} Queued, {n} Executing, {n} Failed, {n} Completed.
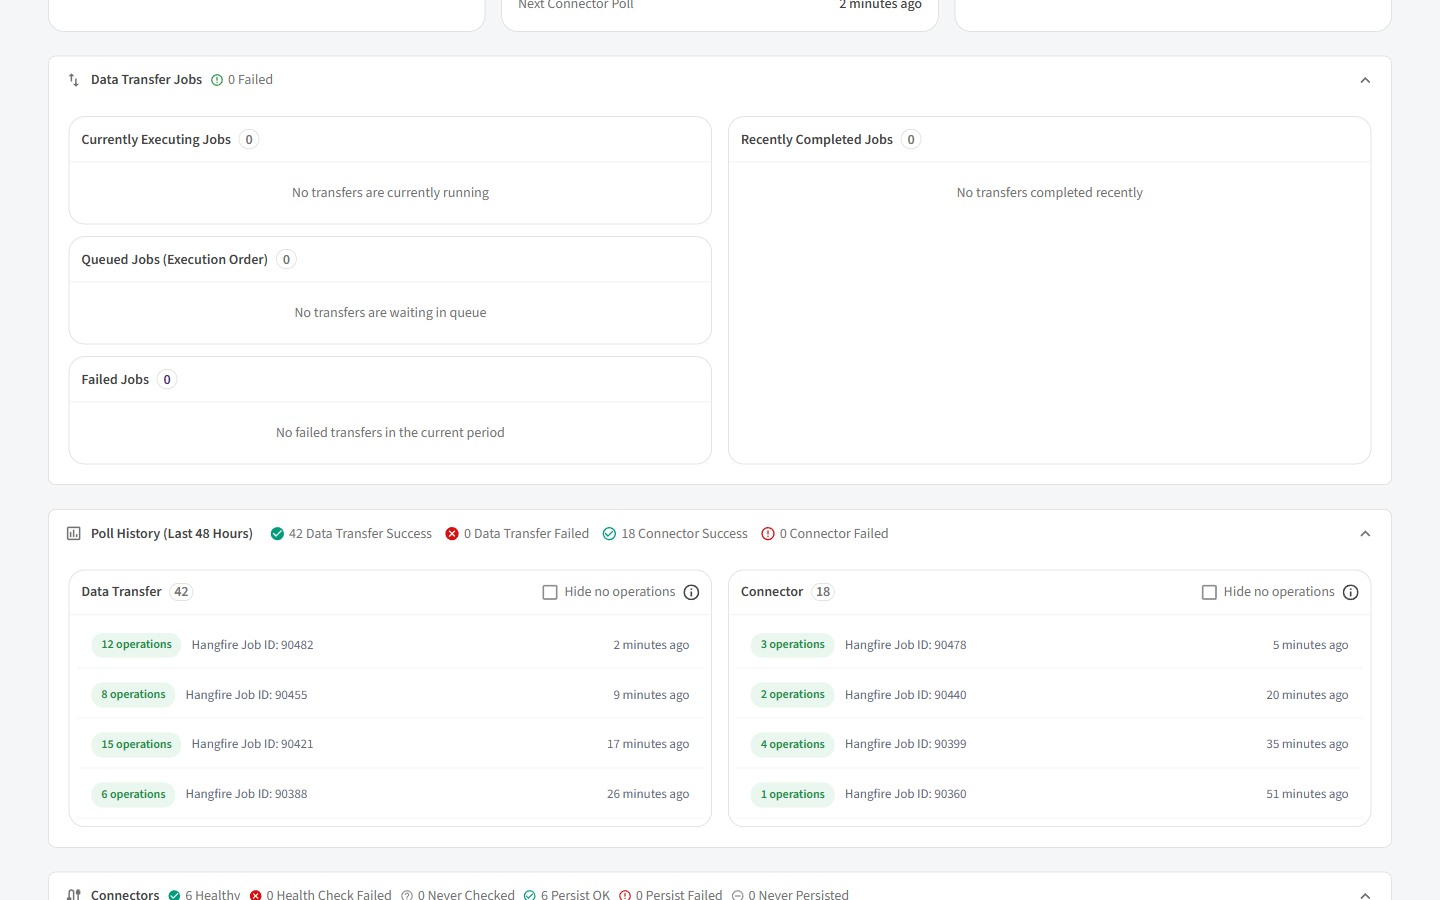
- Currently Executing Jobs — transfers running now. Each row shows the connector, the Data transfer ID, the Hangfire Job ID (an internal job reference useful when contacting support), whether it is an Upload or Download, the Exchange Agreement title, and the start/elapsed time. Empty state: No transfers are currently running.
- Queued Jobs (Execution Order) — what is waiting, in the order it will run, each with a position number. Empty state: No transfers are waiting in queue.
- Failed Jobs — transfers that failed in the current period. Each row carries an error icon you can hover for the message, and — importantly — a Succeeded later marker when a later attempt of the same transfer went through, so a one-off failure that has since recovered is obvious. Empty state: No failed transfers in the current period.
- Recently Completed Jobs — transfers that finished successfully, with their duration. Empty state: No transfers completed recently.
Rows link through to the Transfer Center (or, for a failure, the Exchange Agreement's event log) so you can drill into any one transfer.
Poll History (last 48 hours)
A record of the component's check-ins over the last 48 hours, split into Data Transfer polls and Connector polls. The header summarizes the period: Data Transfer Success, Data Transfer Failed, Connector Success, Connector Failed counts.
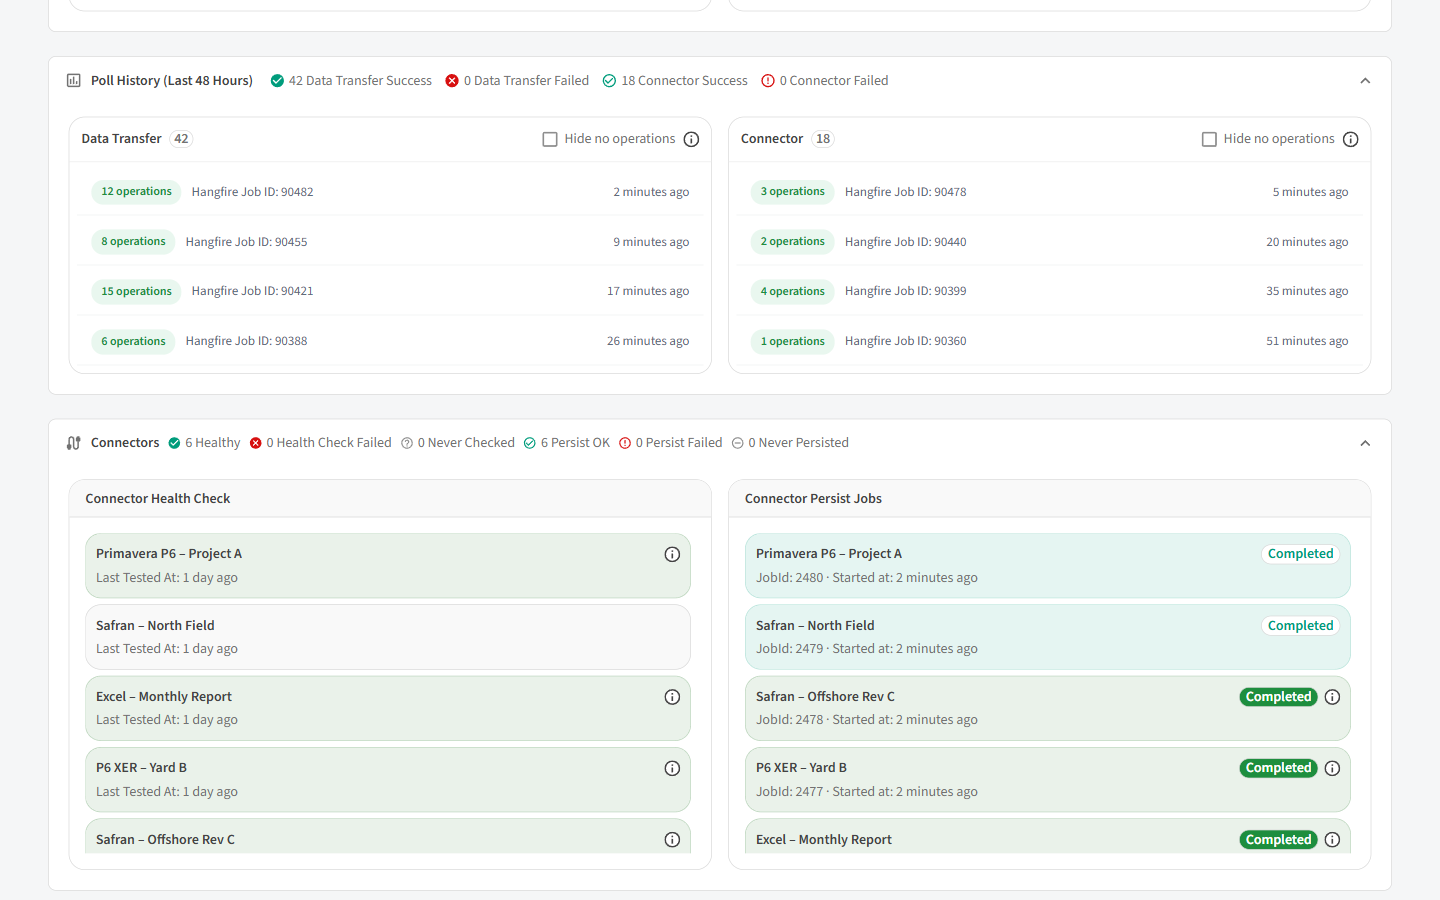
Each poll row shows how many operations that poll pulled, its Hangfire Job ID, and when it ran; a failed poll carries an error icon with the reason. A healthy component shows a steady run of successful polls. A gap, or a run of failed polls, points to a connection or component problem rather than a problem with any single transfer.
Each column has a Hide no operations checkbox so you can hide the routine "nothing to do" polls and see only the check-ins that actually did work.
Connectors
The health of the connectors the Autonomous Component runs. The header badges summarize them: {n} Healthy, {n} Health Check Failed, {n} Never Checked, {n} Persist OK, {n} Persist Failed, {n} Never Persisted.
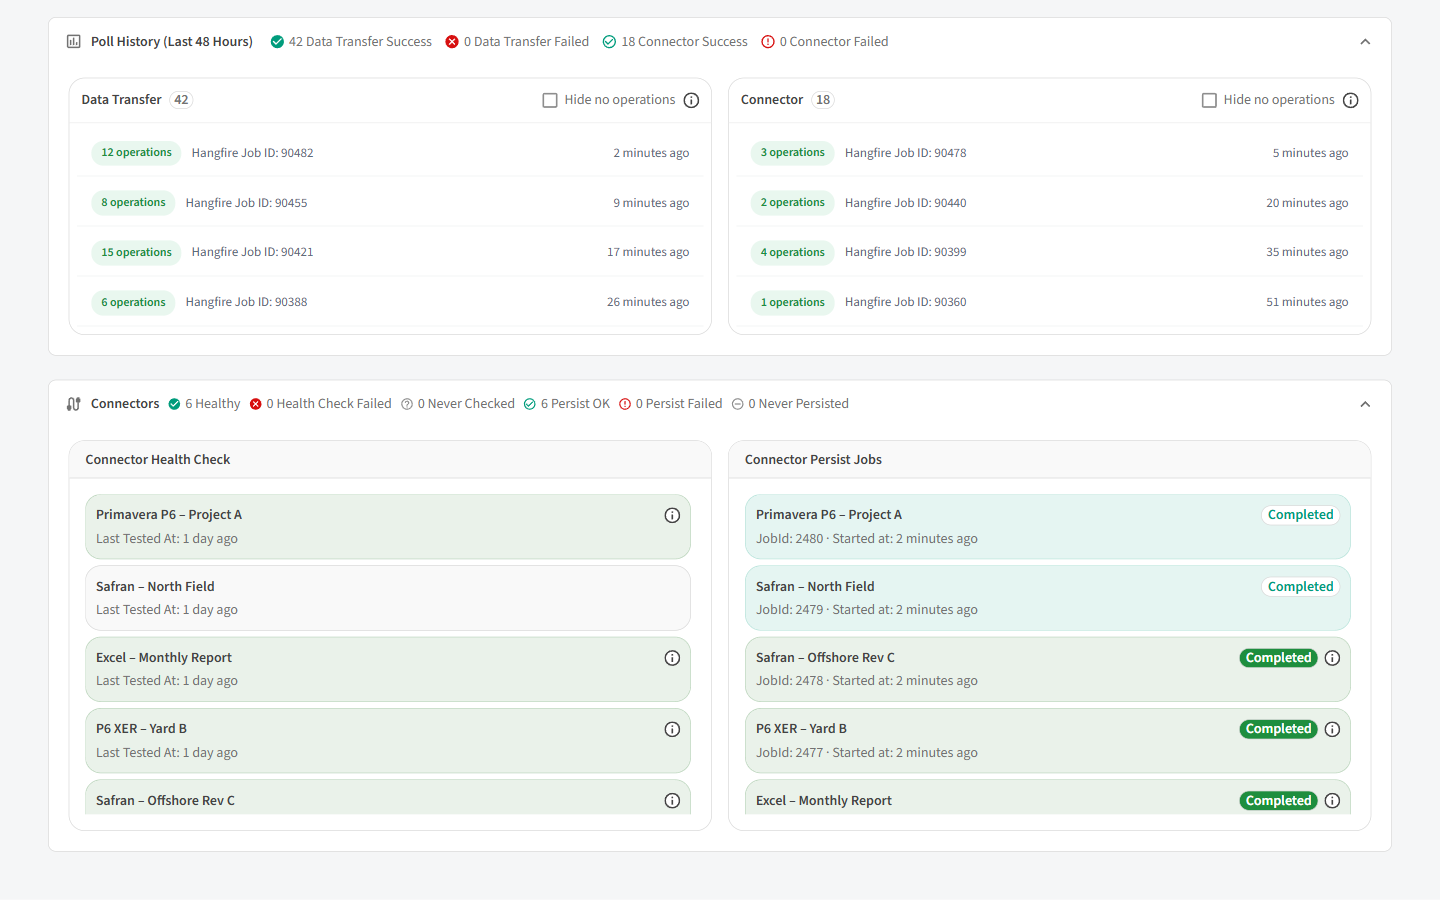
- Connector Health Check — each connector with a Healthy / Unhealthy / Unknown status, the Last Tested At time, and an error icon (hover for the reason) when unhealthy. An unhealthy connector is usually why its transfers are failing.
- Connector Persist Jobs — the latest persist (schema-read) job per connector, with a Completed / Failed / Crashed / Running status, the job id and start time, and the error on failure.
How to read the colors and badges
The dashboard uses a consistent color language:
| Color | Meaning |
|---|---|
| Green | Healthy / succeeded / up to date / running normally. |
| Red | Failed / unhealthy / incompatible — needs attention. |
| Amber (warning) | A caution — for example a growing queue, or a component that is behind on version. |
| Grey (neutral) | Not yet known — never checked, never persisted, or no data yet. |
Times are shown as a friendly "relative" value (for example 2 minutes ago); hover to see the exact timestamp.
Refreshing and filtering
- Refresh — the button in the top right reloads every panel with the latest state. The dashboard does not stream continuously, so refresh when you want the current picture.
- Hide no operations — on each Poll History column, hides the routine empty check-ins.
- The large panels (Data Transfer Jobs, Poll History, Connectors) can be collapsed and expanded so you can focus on one at a time.
There is no date filter or export on this screen — it is a live operational view, fixed to the current state and the last 48 hours of polling. For historical and exportable transfer analysis, use the Reports.
Using the dashboard to troubleshoot
A quick reading order when something looks wrong:
- Component Status + Last Updated At. If the heartbeat is stale and nothing is executing, the component itself may be stopped — check it is running on your host.
- Polling Status / Poll History. Recent successful polls mean it is talking to SchedEx. A run of failed polls points to a network or authentication problem, not a single bad transfer.
- Failed Jobs. Hover the error for the reason. Check the Succeeded later marker — the failure may already have recovered on a retry.
- Connectors. An Unhealthy connector, or a Failed persist job, explains why that connector's transfers are not going through.
If you need to send logs to support while investigating, see Support logs.
Related guides
- Controlling transfers for the Autonomous Component — automatic vs. approved uploads and downloads, and who approves.
- Support logs — requesting and sharing Autonomous Component logs.
- Reports — historical, exportable transfer analysis.
- Glossary — shared SchedEx terms.
Was this article helpful?
That’s Great!
Thank you for your feedback
Sorry! We couldn't be helpful
Thank you for your feedback
Feedback sent
We appreciate your effort and will try to fix the article