TABLE OF CONTENTS
- Introduction
- Who can see reports
- Finding your way around
- The filters, explained once
- Overview reports
- Performance reports
- Errors and warnings reports
- Usage reports
- Investigating a single transfer
- Related guides
Introduction
The Reports area turns your transfer history into answers: how much data moved, how reliably, what went wrong, and who you exchanged with. This guide covers every report in detail — what each one shows, how to read the numbers, and what each filter does — so you can get the answer you need without guesswork.
Each report can be filtered (by date and more) and exported to Excel. Many show the same data as both a chart and a table — switch between them with the view toggle.
Who can see reports
Reports are for Tenant Admins and System Admins. Regular users do not see the Reports area.
- A Tenant Admin sees their own tenant's data.
- A System Admin can select one or more tenants to compare, using the tenant filter on each report.
A key definition used throughout: a successful transfer means both the upload and the download succeeded. Several reports count success that way, so a transfer counts only once the data has landed on the receiving side.
Finding your way around
Open Reports from the top navigation. The reports are listed down the left, grouped by category (Overview, Performance, Errors and Warnings, Usage) and searchable; star a report to keep it in your favourites, and SchedEx remembers the last one you opened.
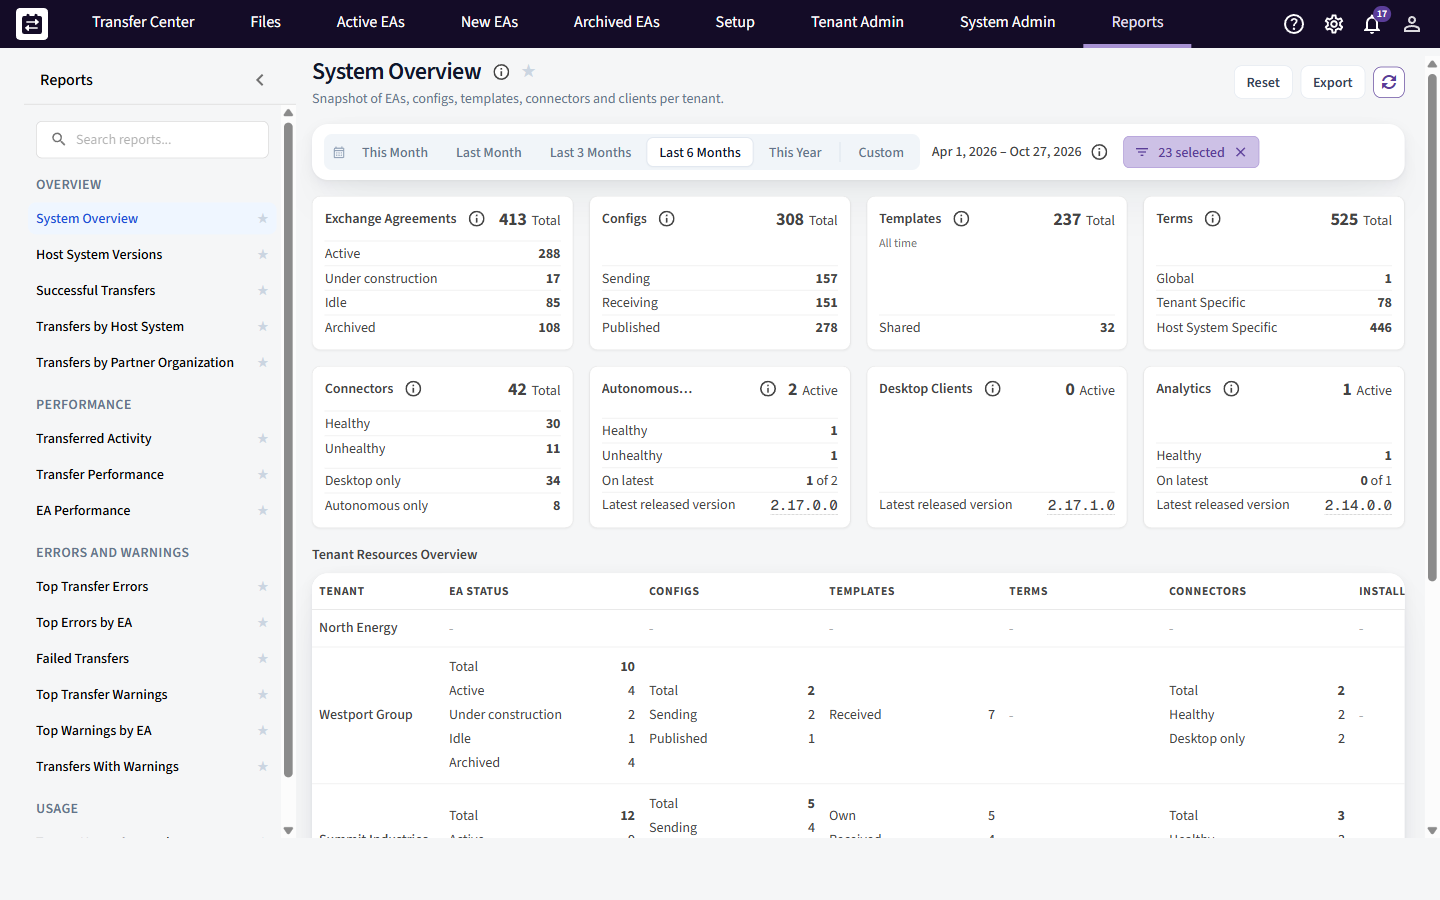
The Reports area: the category sidebar on the left, and a report open on the right with its date presets, tenant filter, and Export button.
Shared controls on every report: a date range, Export to Excel, a Reset for the filters, and a Refresh. Your filter choices are remembered per report.
The filters, explained once
Most reports draw from the same small set of filters. Here is what each one means, so the per-report sections below can stay short.
| Filter | What it does |
|---|---|
| Date range | A preset (This Month, Last Month, Last 3 Months, Last 6 Months, This Year) or a custom from/to. Each report opens on a sensible default. |
| Tenant | System Admin only. Pick one or several tenants to include. A Tenant Admin always sees just their own tenant. |
| Granularity | How time is bucketed when you look over time — Weekly / Monthly / Quarterly / Yearly. |
| Mode | Totals (one number per group for the whole period) vs Over Time (a trend across the buckets). |
| View | Chart (a visual) vs Table (the exact numbers). The same data, shown two ways. |
| Direction / Flow | Which way the data moved. The three meanings you will see are: Within Same Tenant — both sides are your organization (internal); From Tenant to Another — you sent data out to a different organization; To Tenant from Another — you received data from a different organization. On some reports this appears as Sent / Received / Total or Upload / Download. |
| Scope (Successful Transfers) | Narrows to External Sent, Received, or Internal activity. |
| Metric (host-system report) | Incoming, Outgoing, or Total activities. |
| Include retries | Whether repeated attempts of the same transfer are counted, or only the final result. |
| Error / warning source, category, code | On the error and warning reports: narrow to a host-system source, a category, or a specific code. |
| Stopped only | On error reports: show only errors that actually stopped a transfer (as opposed to errors that were recorded but did not halt it). |
Overview reports
High-level pictures of what your tenant has and what it has moved.
System Overview
Answers: "What do we have, and is it healthy?"
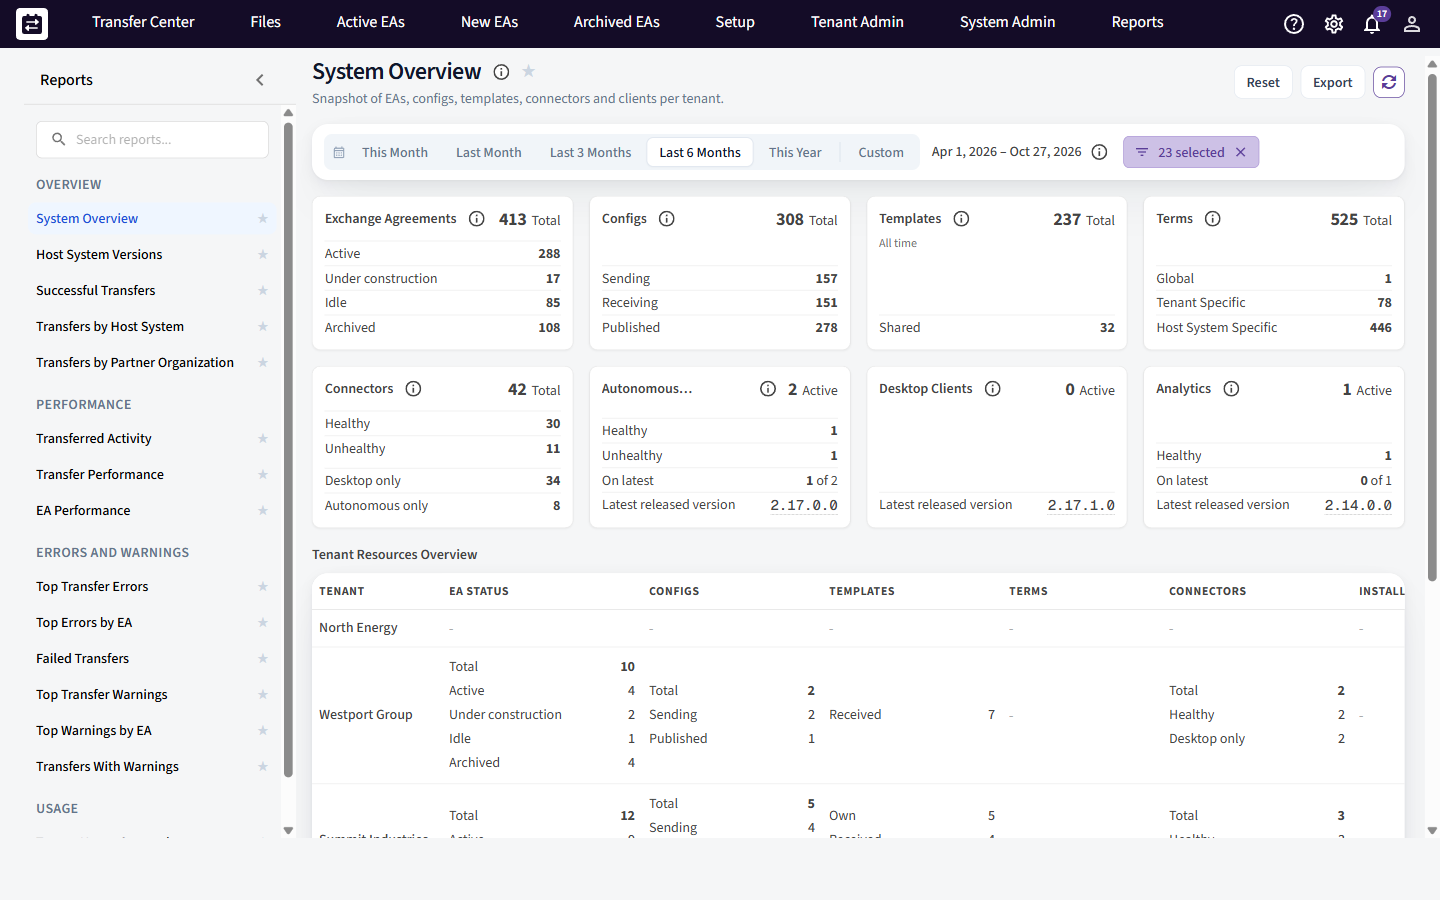
System Overview: KPI tiles across the top, and a per-tenant resources table below.
- What you see — KPI tiles: counts for Exchange Agreements (Total / Active / Under construction / Idle / Archived), Configs (Total / Sending / Receiving / Published), Templates, Terms (Global / Tenant-specific / Host-system-specific), Connectors (Total / Healthy / Unhealthy / Desktop / Autonomous), and your Autonomous Components, Desktop Clients and analytics clients — each with how many are on the latest released version and how many are healthy.
- Tenant Resources table: the same counts broken down per tenant, so a System Admin can compare tenants at a glance.
- How to read it: use the health and "on latest version" figures to spot clients that need updating, and the EA/Config counts to see how much is set up versus actually active.
- Filters: date range, tenant.
Host System Versions
Answers: "What version of each host system are our connectors talking to, and are they still reachable?"
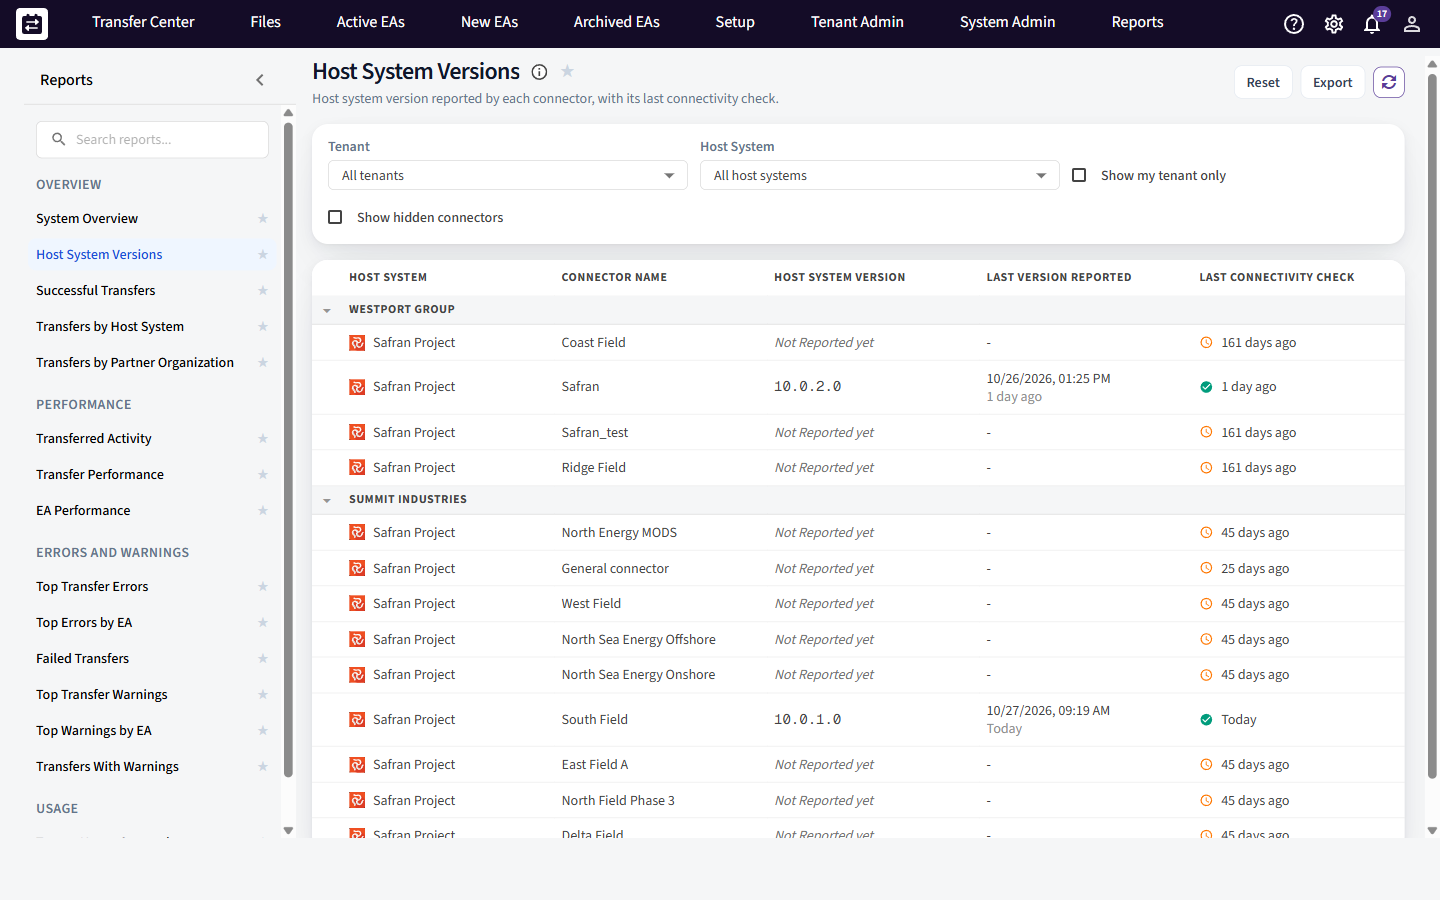
Host System Versions: the version each connector's host system reported, when it was last reported, and the last connectivity check — grouped by tenant.
- What you see: one row per connector, grouped by tenant, with its host system (Safran, SAP, P6, …), the host system version it reported (for example
10.0.2.0, or Not reported yet), when that version was last reported, and the last connectivity check (a green tick for a recent successful check, an amber clock for one that is stale). - How to read it: a connector that has not reported a version, or whose last connectivity check is days old, may no longer be reachable — worth checking before you rely on it.
- Filters: tenant, host system, Show my tenant only, and Show hidden connectors.
Successful Transfers
Answers: "How many activities did we successfully transfer, and in which direction?"
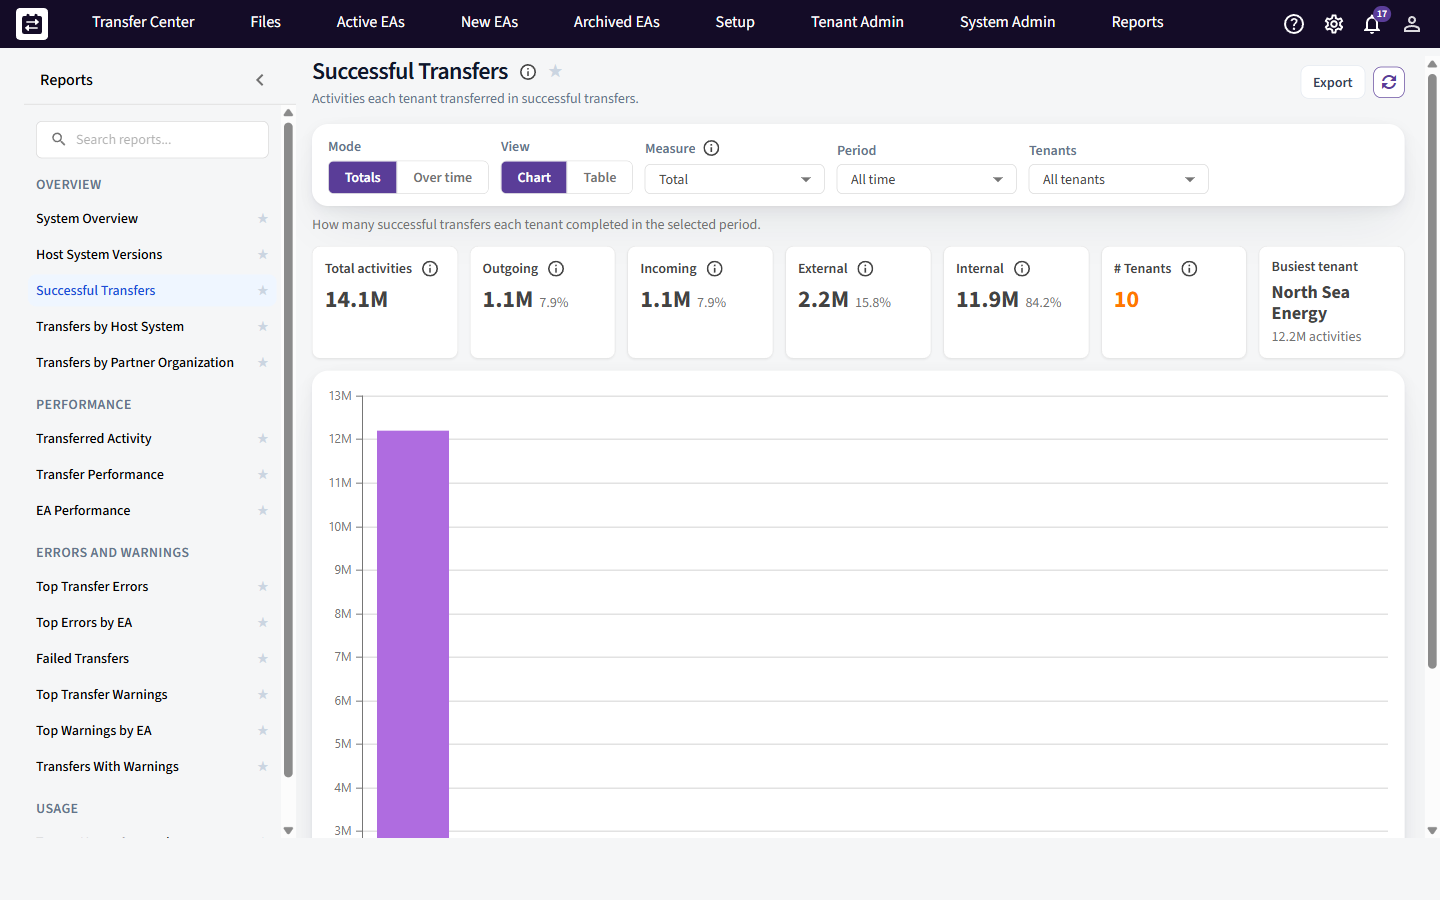
Successful Transfers: activity volume by tenant and scope, shown here as a chart (toggle to table for the exact numbers).
- What you see: the number of activities moved in successful transfers, split by scope — External Sent, Received, and Internal (within your own organization).
- Chart vs table: the chart shows the trend or split visually; the table gives the exact activity counts per tenant and scope.
- Filters: date range, granularity (for over-time), scope, mode (Totals / Over Time), view (Chart / Table), tenant.
Transfers by Host System
Answers: "Which host systems is our data flowing through?"
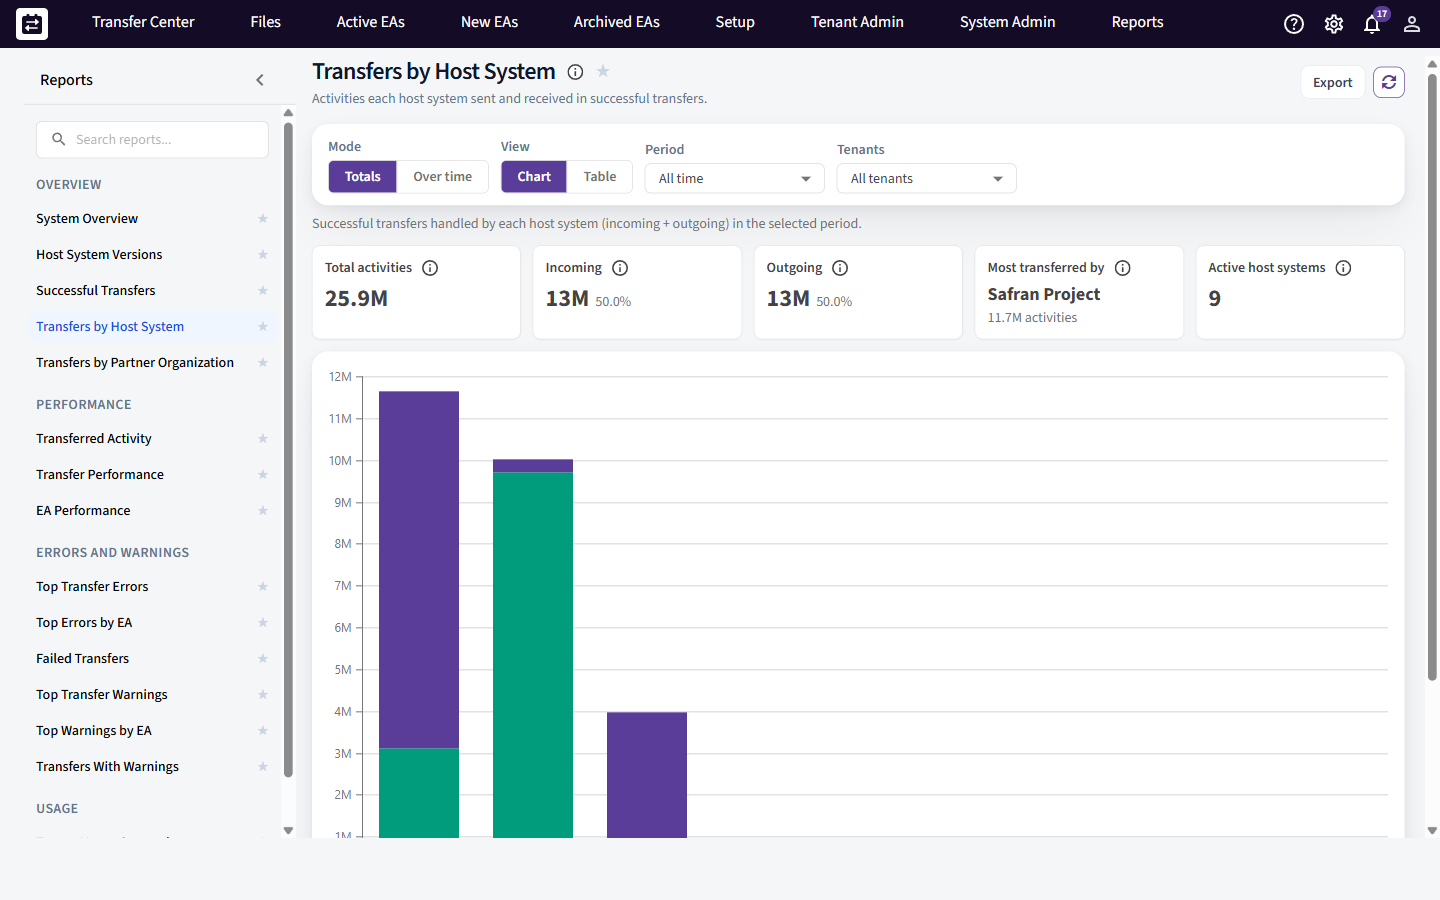
Transfers by Host System: activities each host system sent and received.
- What you see: for each host system (SAP, P6, Safran, Excel, …), how many activities it sent (Outgoing) and received (Incoming) in successful transfers.
- Chart vs table: the chart compares host systems; the table lists the incoming/outgoing/total counts.
- Filters: date range, granularity, metric (Incoming / Outgoing / Total), mode, view.
Transfers by Partner Organization
Answers: "Who are we exchanging the most data with?"
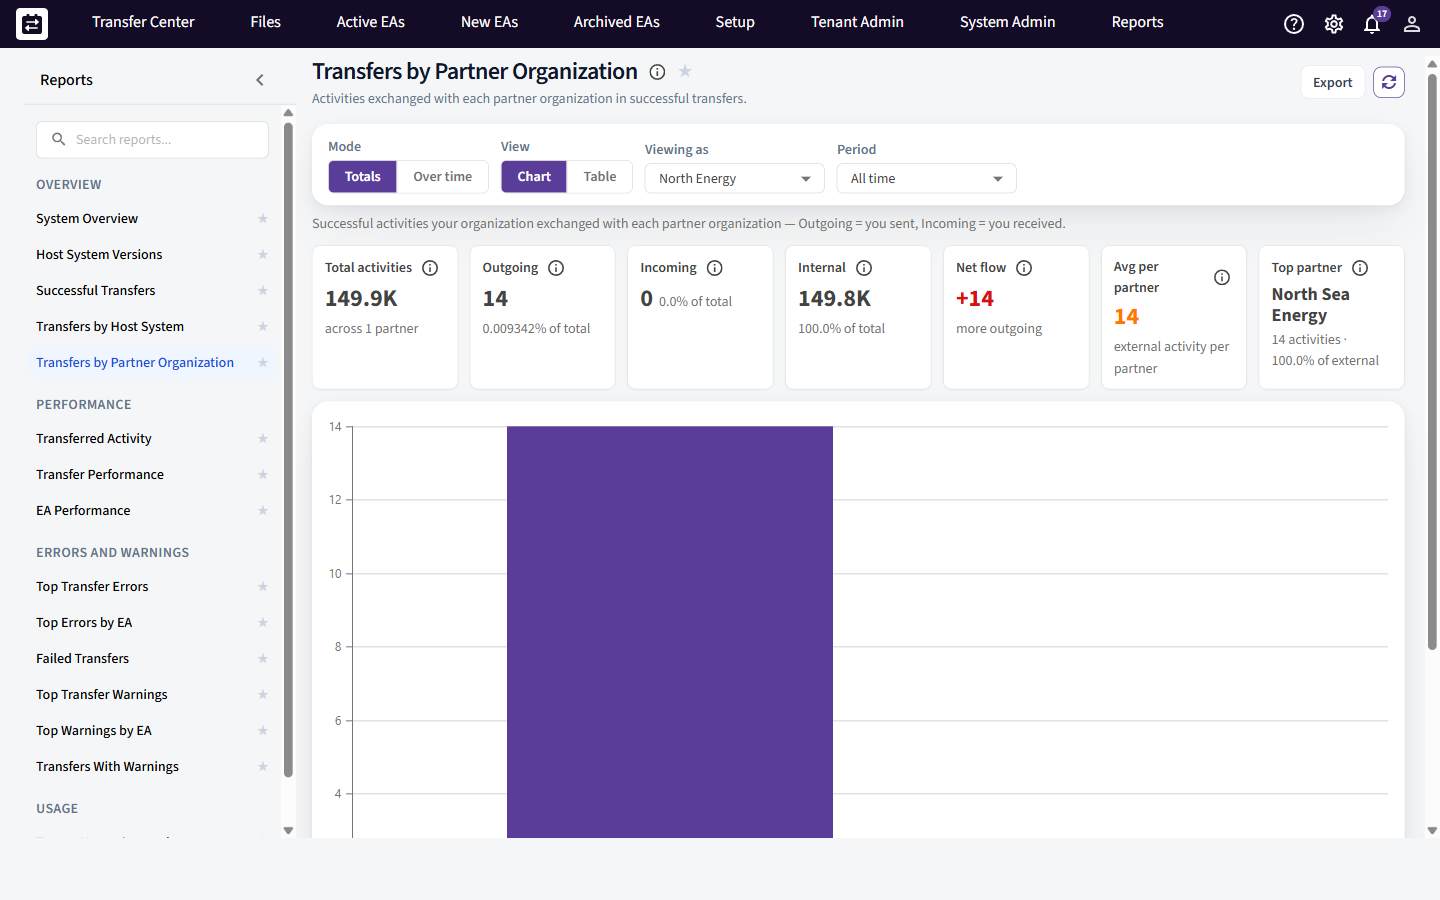
Transfers by Partner Organization: activity exchanged with each counterparty, with internal transfers shown separately.
- What you see: the activities exchanged with each partner organization — Sent, Received and Total — with internal (within-tenant) transfers listed on their own line.
- Chart vs table: the chart ranks partners by volume; the table gives the per-partner breakdown.
- Filters: date range, granularity, direction (Sent / Received / Total), mode, view.
Performance reports
How much moved, and how reliably.
Transferred Activity
Answers: "How is our transfer volume trending?"
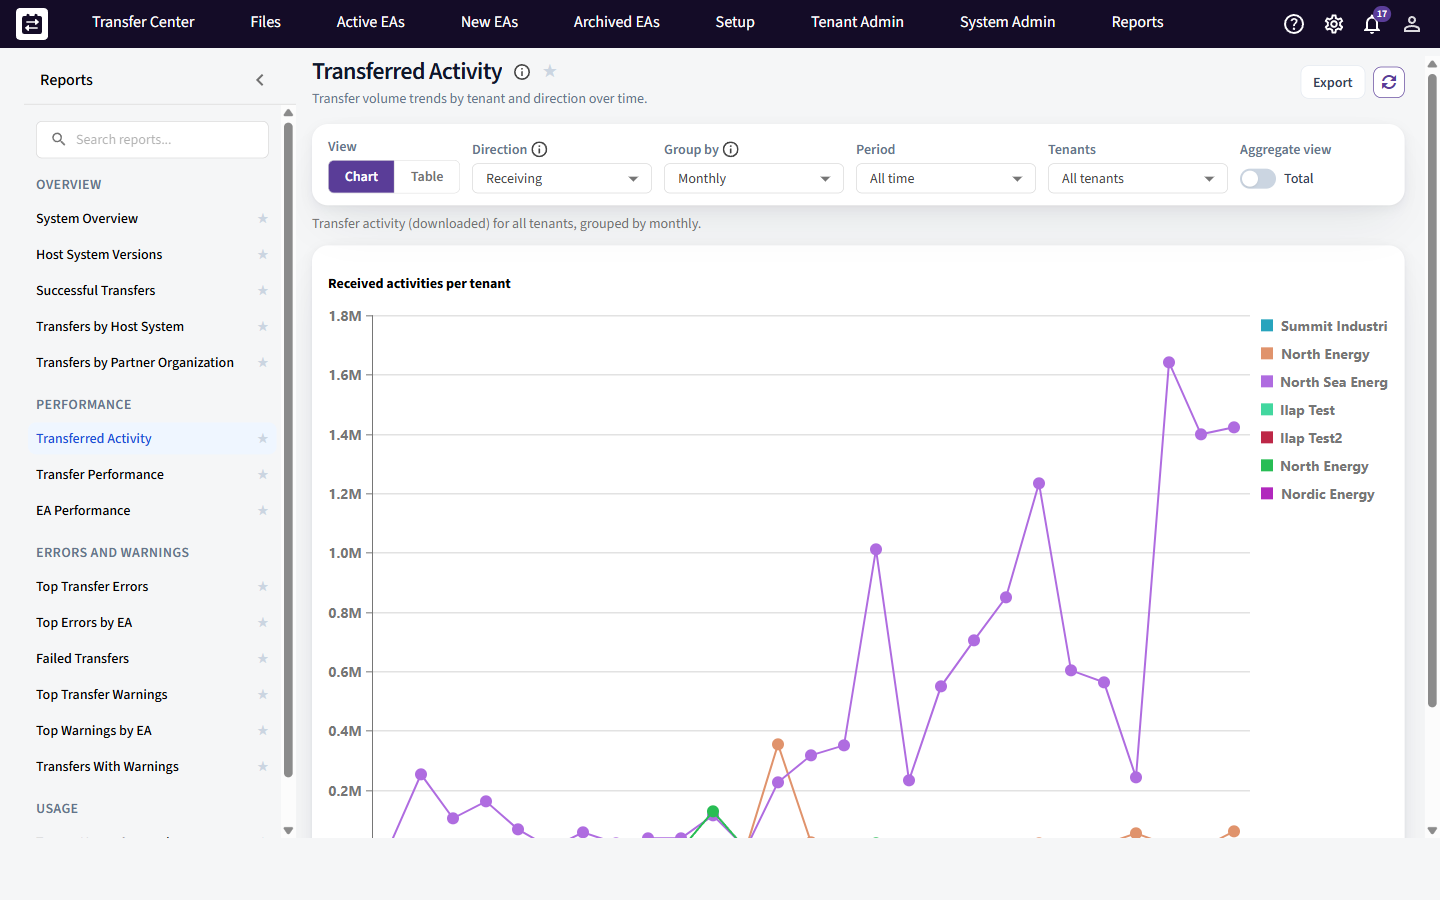
Transferred Activity: activity volume over time, split by direction.
- What you see: the number of activities transferred over time, split by tenant and by direction (Upload / Download), as a line chart plus a supporting table.
- How to read it: rising or falling lines show how your exchange volume is changing; compare upload vs download to see whether you send or receive more.
- Filters: date range, direction, granularity.
Transfer Performance
Answers: "How reliable are our transfers?"
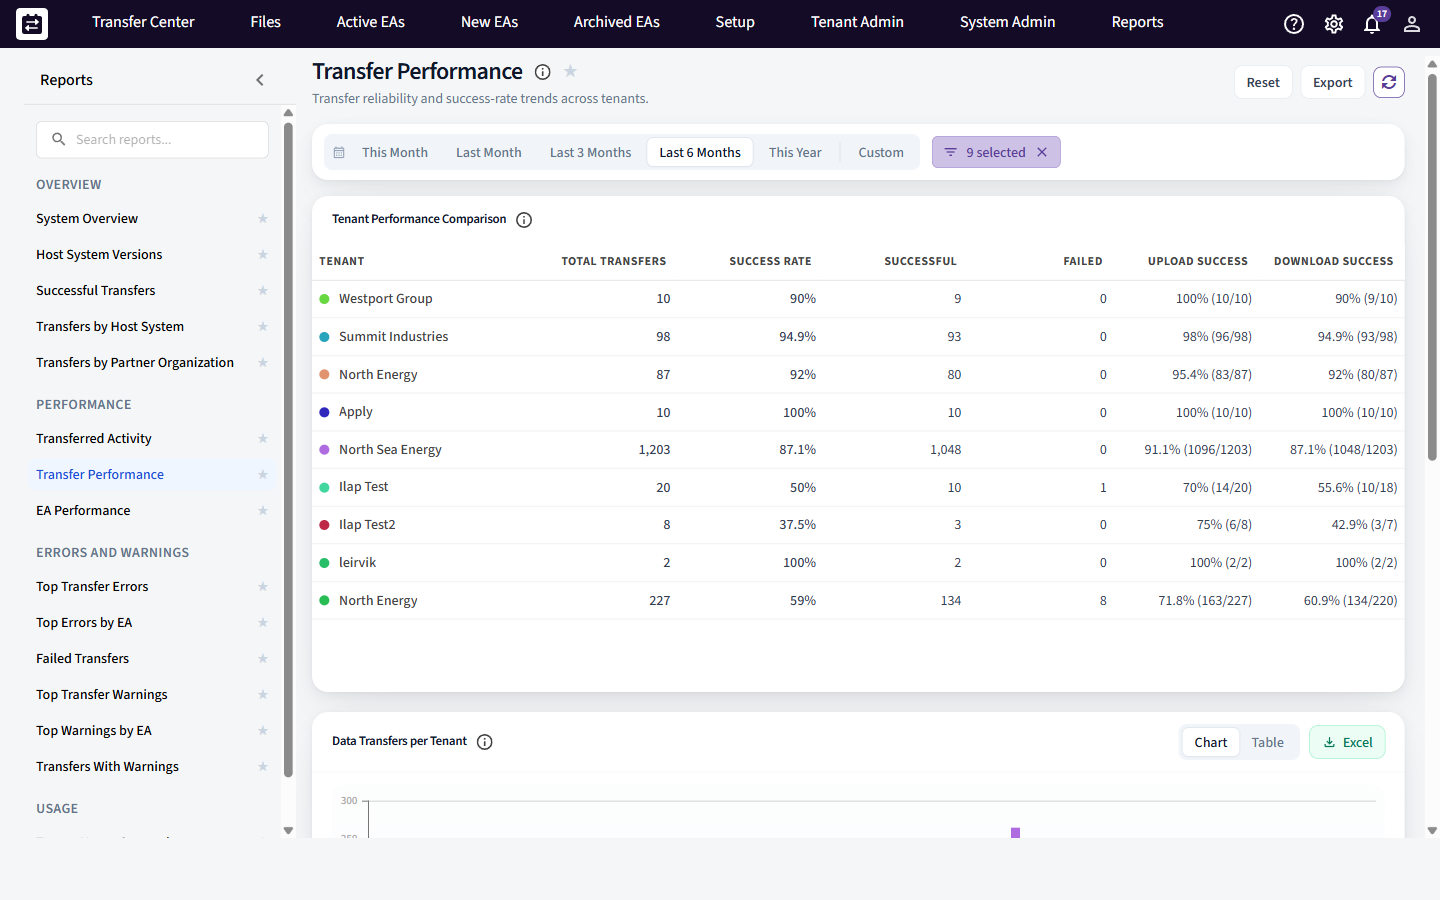
Transfer Performance: success-rate trend, and a per-tenant reliability matrix.
- What you see: the overall success rate over time, plus a per-tenant matrix: Total transfers, Success and Failed counts, Success Rate %, and the split into Upload vs Download attempted / succeeded / rate. (Remember: a transfer is "successful" only when both halves succeed.)
- How to read it: a low download rate with a high upload rate, for example, points to problems on the receiving side rather than the sending side.
- Filters: date range, tenant.
EA Performance
Answers: "How much are our Exchange Agreements actually used?"
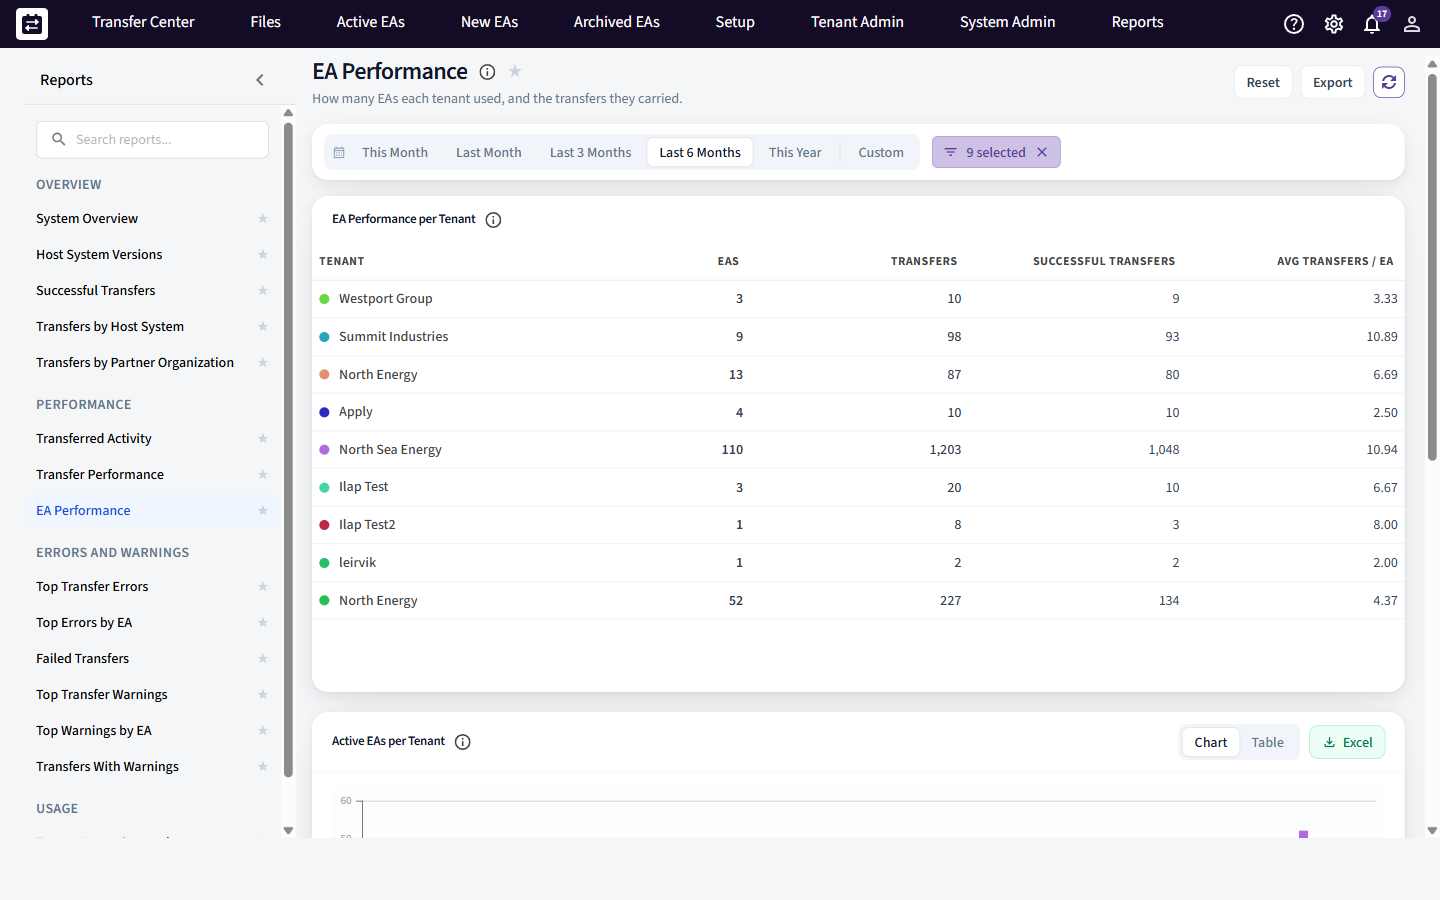
EA Performance: Exchange-Agreement usage and the transfers each carried.
- What you see: per tenant, how many Exchange Agreements were active and how many transfers they carried, with success metrics, over time.
- How to read it: spot agreements that carry a lot of traffic versus ones that are set up but barely used.
- Filters: date range, tenant.
Errors and warnings reports
Find what is failing or flagging, and drill into the detail. Errors stop a transfer; warnings do not, but point to mapping or data problems worth fixing.
Top Transfer Errors
Answers: "What are our most common failures?"
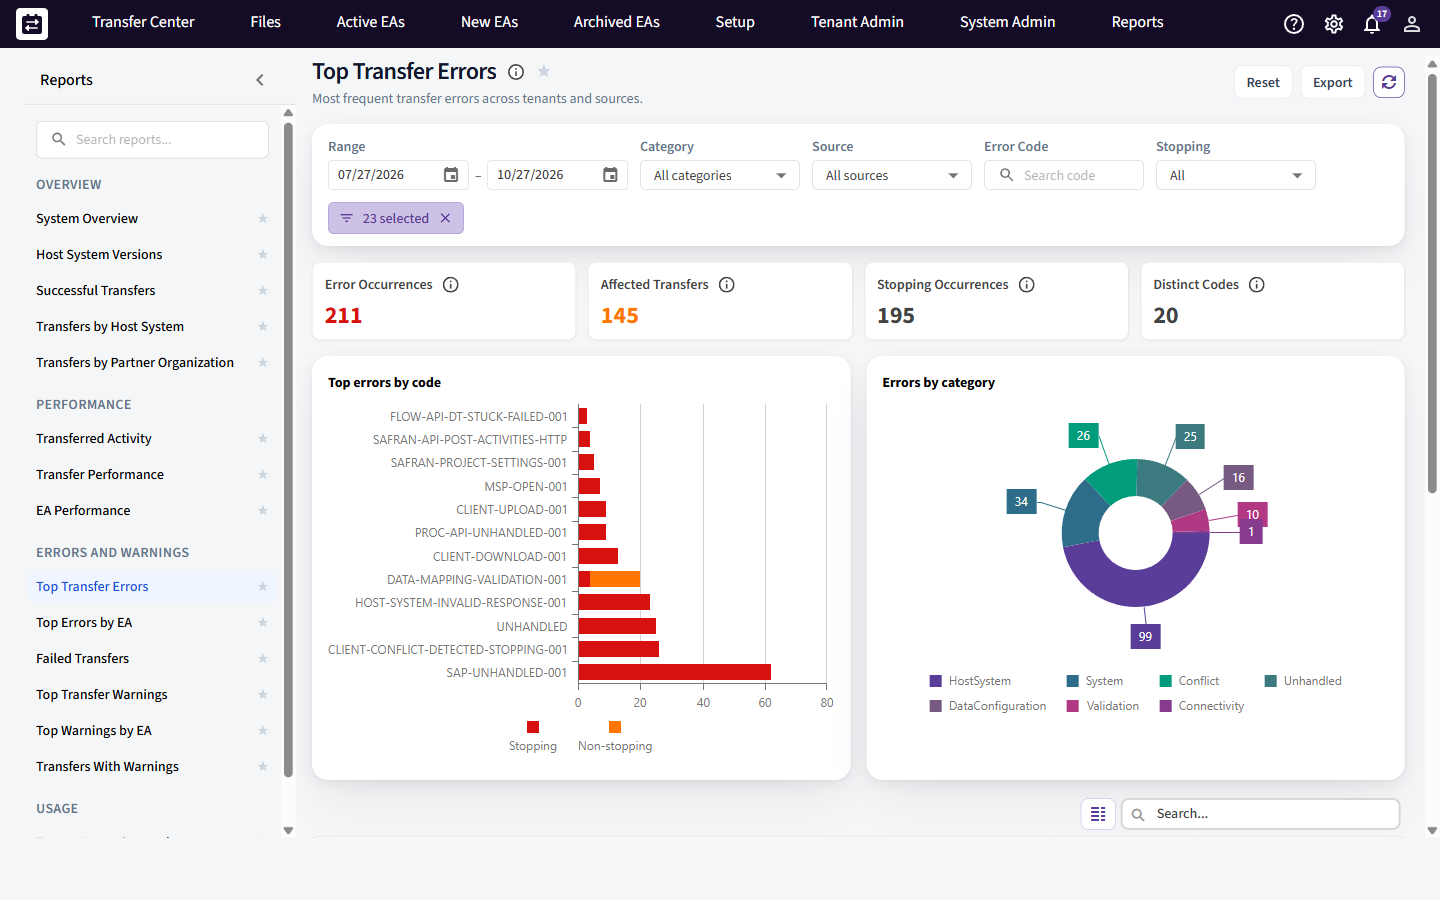
Top Transfer Errors: the most frequent error codes, ranked, with charts by code and by category.
- What you see: the most frequent error codes across all tenants and host systems. Each row is one code and shows Occurrences, Affected Transfers, Stopping Occurrences, a sample message and last seen. Two charts rank the errors by code and by category.
- Drill-down: click Affected Transfers to see exactly which transfers hit that error.
- Filters: date range, error source, category, code, stopped only, tenant.
Top Errors by EA
Answers: "What's failing on this one agreement?"
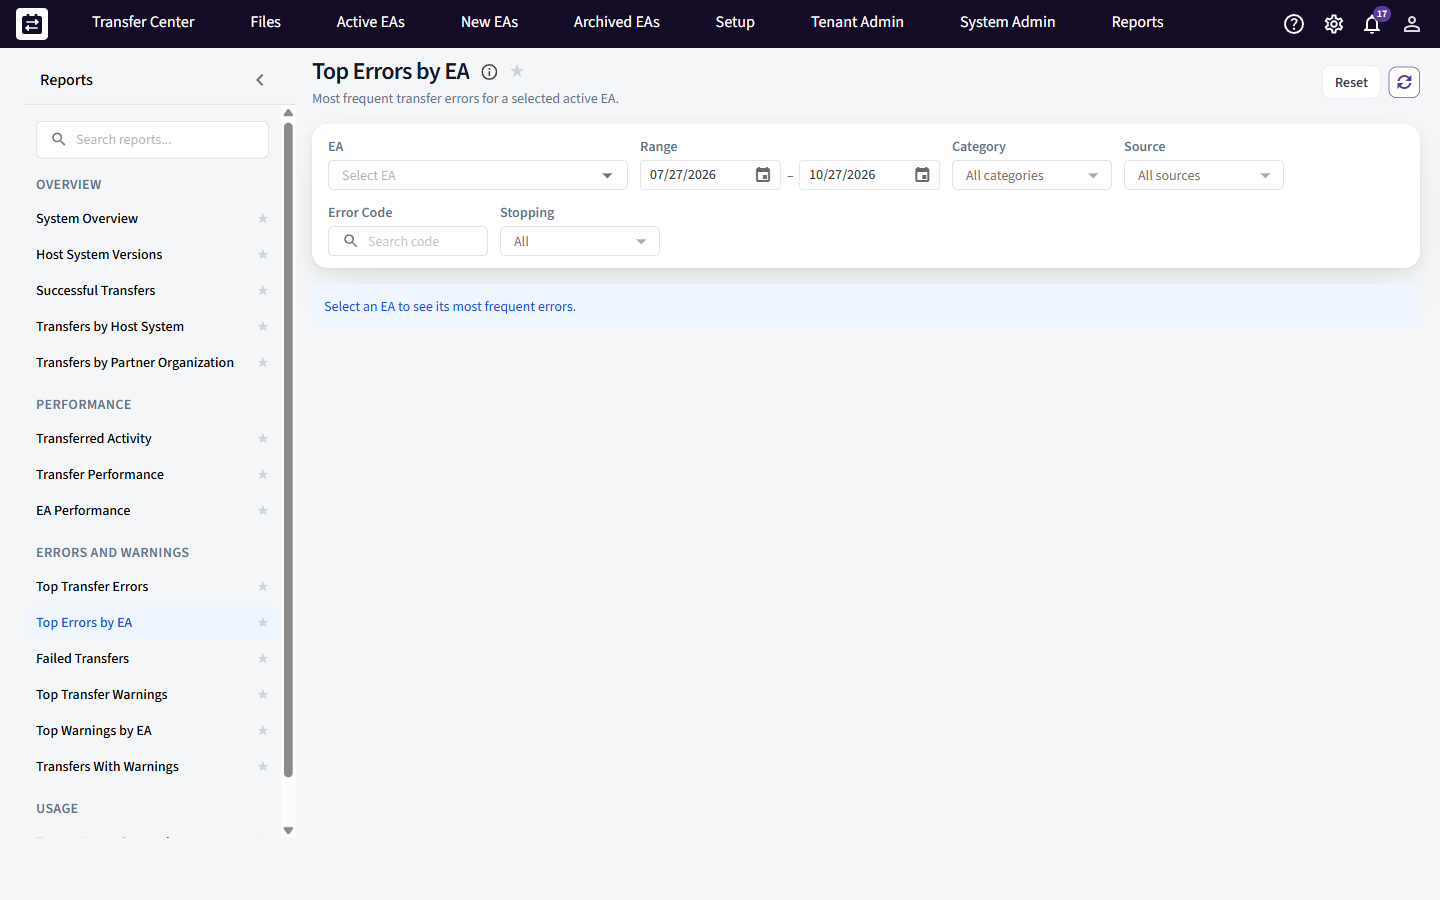
Top Errors by EA: the same error ranking, scoped to a single Exchange Agreement you choose.
- What you see: the same ranking as Top Transfer Errors, but for a single Exchange Agreement you pick first.
- Filters: EA selector (required), date range, direction, source / category / code, stopped only, tenant.
Failed Transfers
Answers: "Show me the recent failures so I can investigate them."
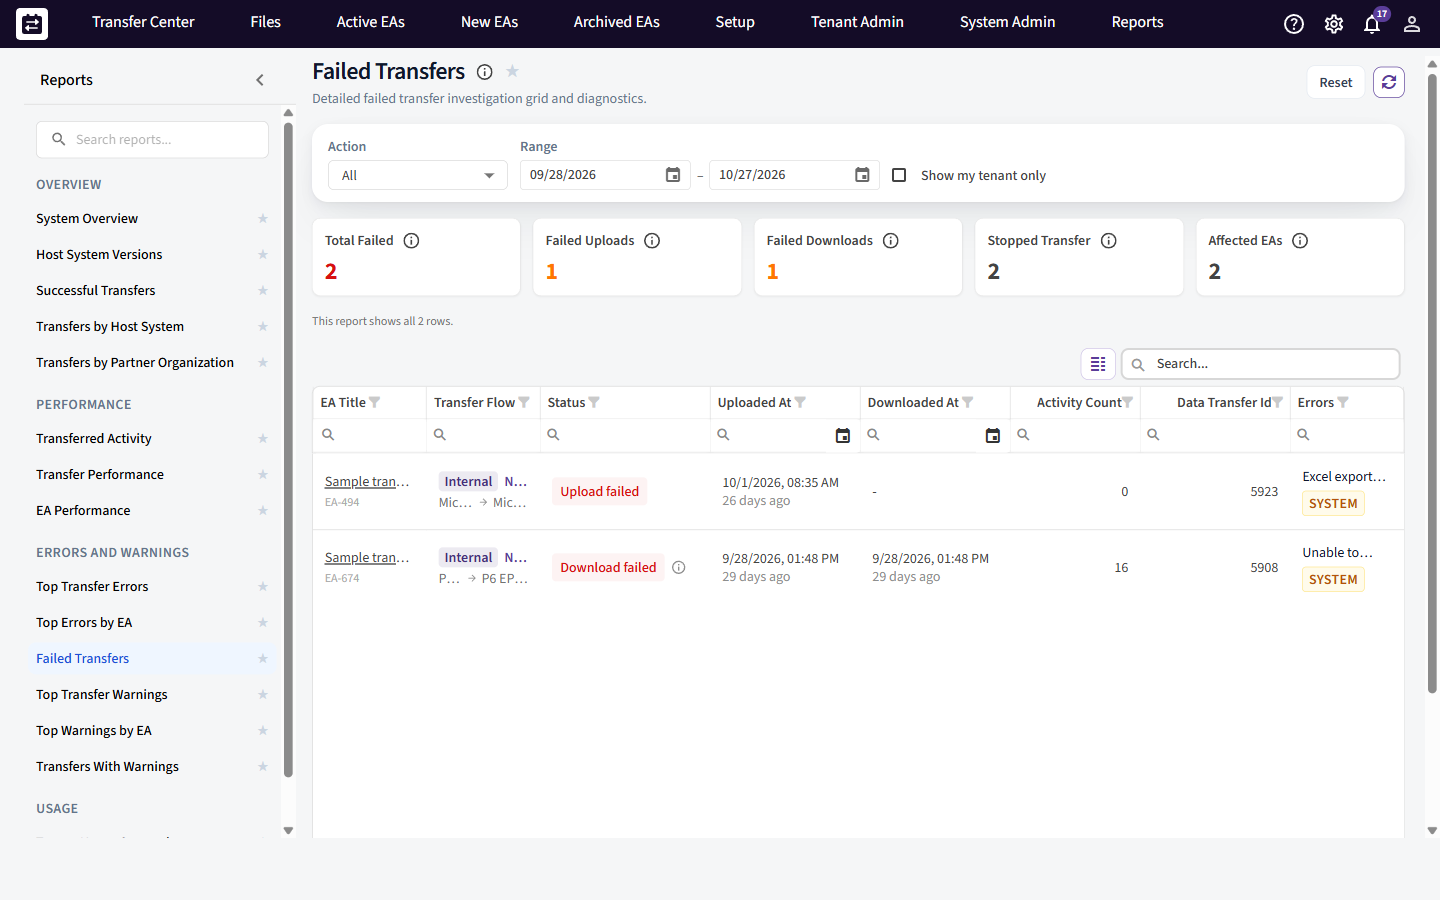
Failed Transfers: a detailed grid of recent failures; expand a row for the full error list.
- What you see: the most recent failed uploads and downloads in a detailed grid — EA title and ID, transfer flow, upload deadline, status, frequency, template, sender and receiver schedules, sending and receiving components, uploaded/downloaded at, activity count, durations, data transfer ID, and the list of errors per attempt.
- Drill-down: expand a row to read the full error stack, or open the transfer's diagnostics (see Investigating a single transfer).
- Filters: date range, direction, Show my tenant only, tenant.
Top Transfer Warnings
Answers: "What are the most common warnings?"
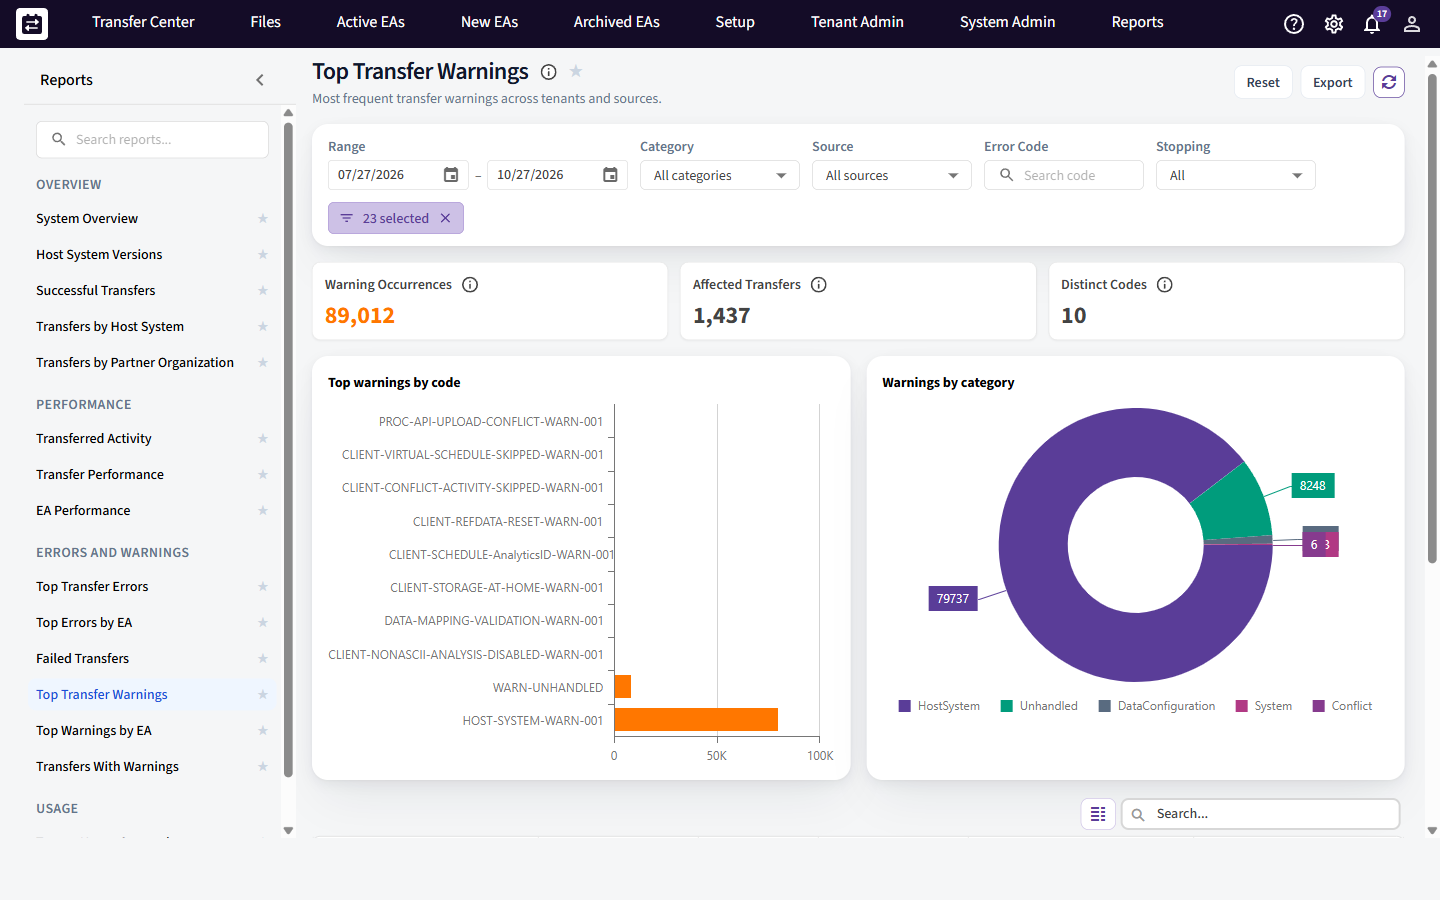
Top Transfer Warnings: the most frequent warning codes, ranked like the errors report.
- What you see: the most frequent warning codes, ranked, with the same columns and charts as Top Transfer Errors. Warnings do not stop a transfer but usually mean a value was dropped or adjusted.
- Drill-down: click Affected Transfers to see which transfers raised a warning.
- Filters: date range, warning source / category / code, tenant.
Top Warnings by EA
Answers: "What's flagging on this one agreement?"
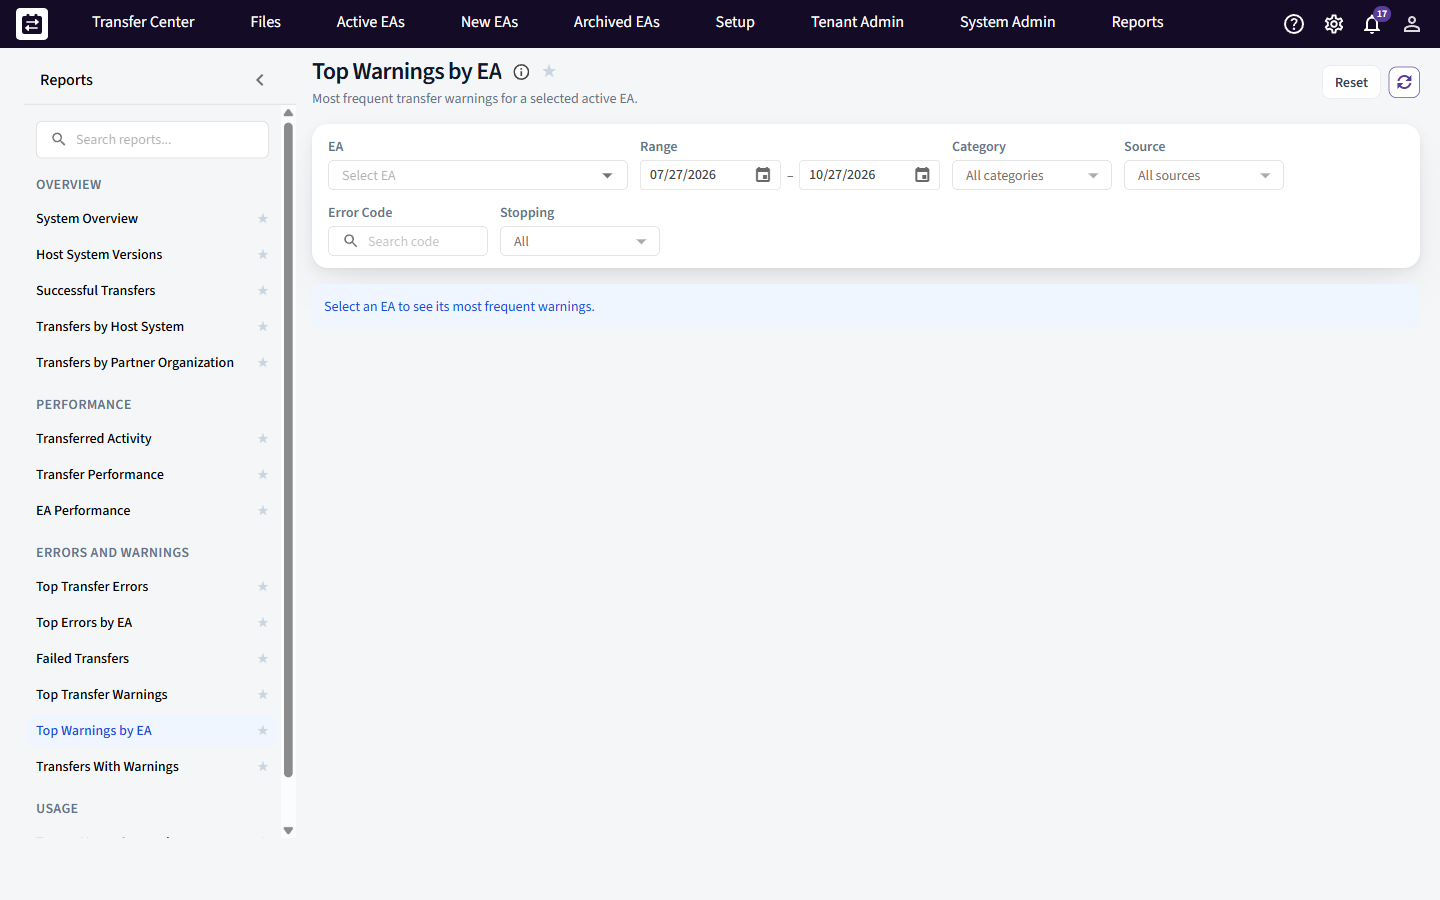
Top Warnings by EA: the warning ranking scoped to a single Exchange Agreement.
- What you see: the warning ranking for a single Exchange Agreement you pick.
- Filters: EA selector (required), date range, direction, source / category / code, tenant.
Transfers With Warnings
Answers: "Which transfers carried warnings, and what were they?"
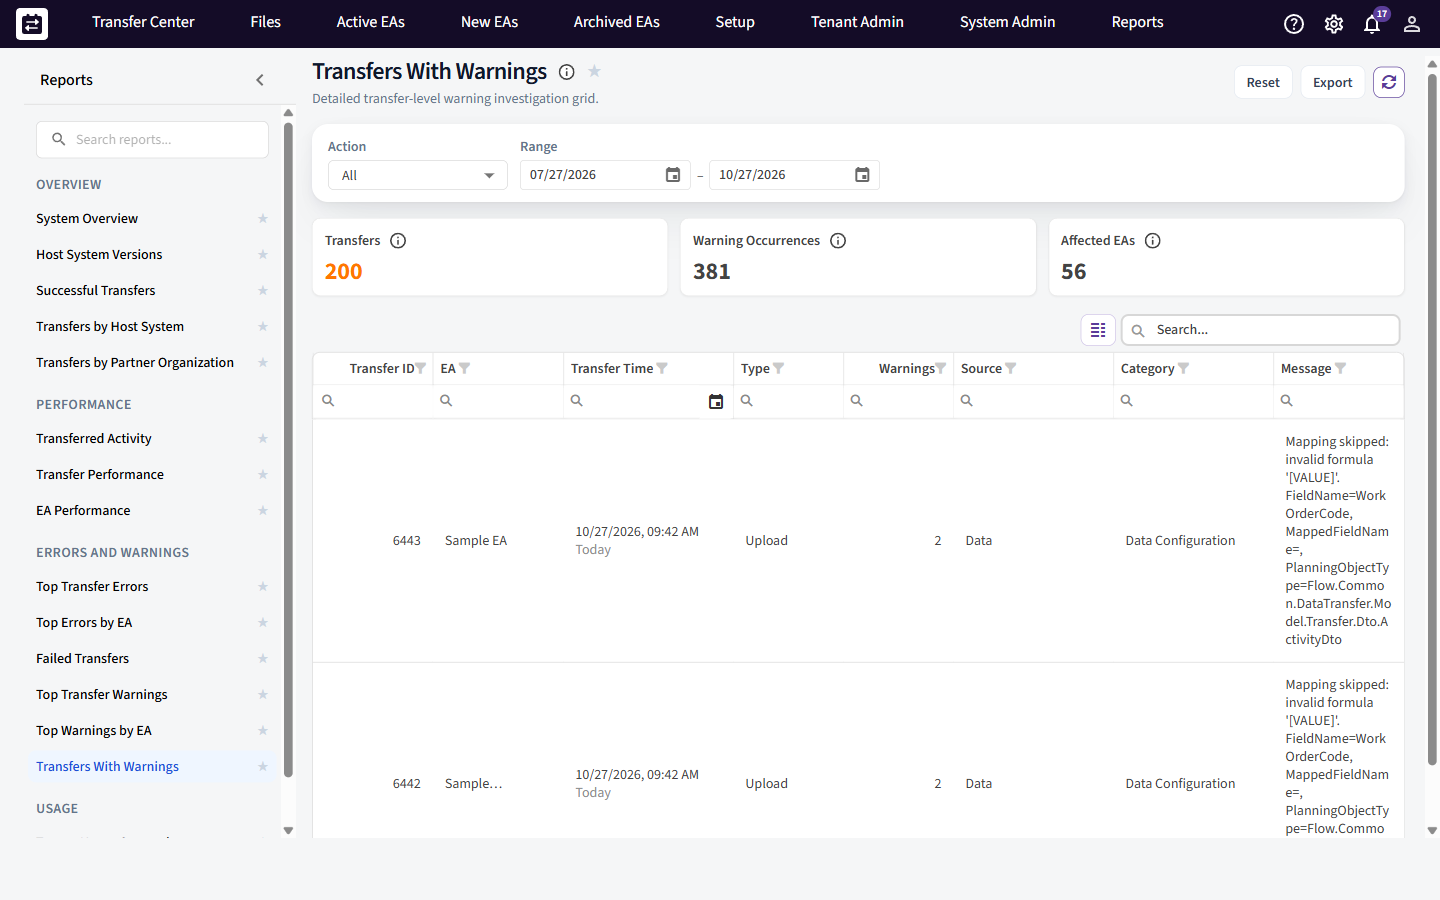
Transfers With Warnings: one row per transfer that carried at least one warning.
- What you see: a grid of uploads/downloads that had at least one warning — transfer ID, EA, transfer time, type (Upload/Download), warning count, and the warning code, source, category and message.
- Filters: date range, direction, tenant.
Usage reports
Tenant Usage Comparison
Answers: "How does activity compare across tenants, and how much stayed internal?"
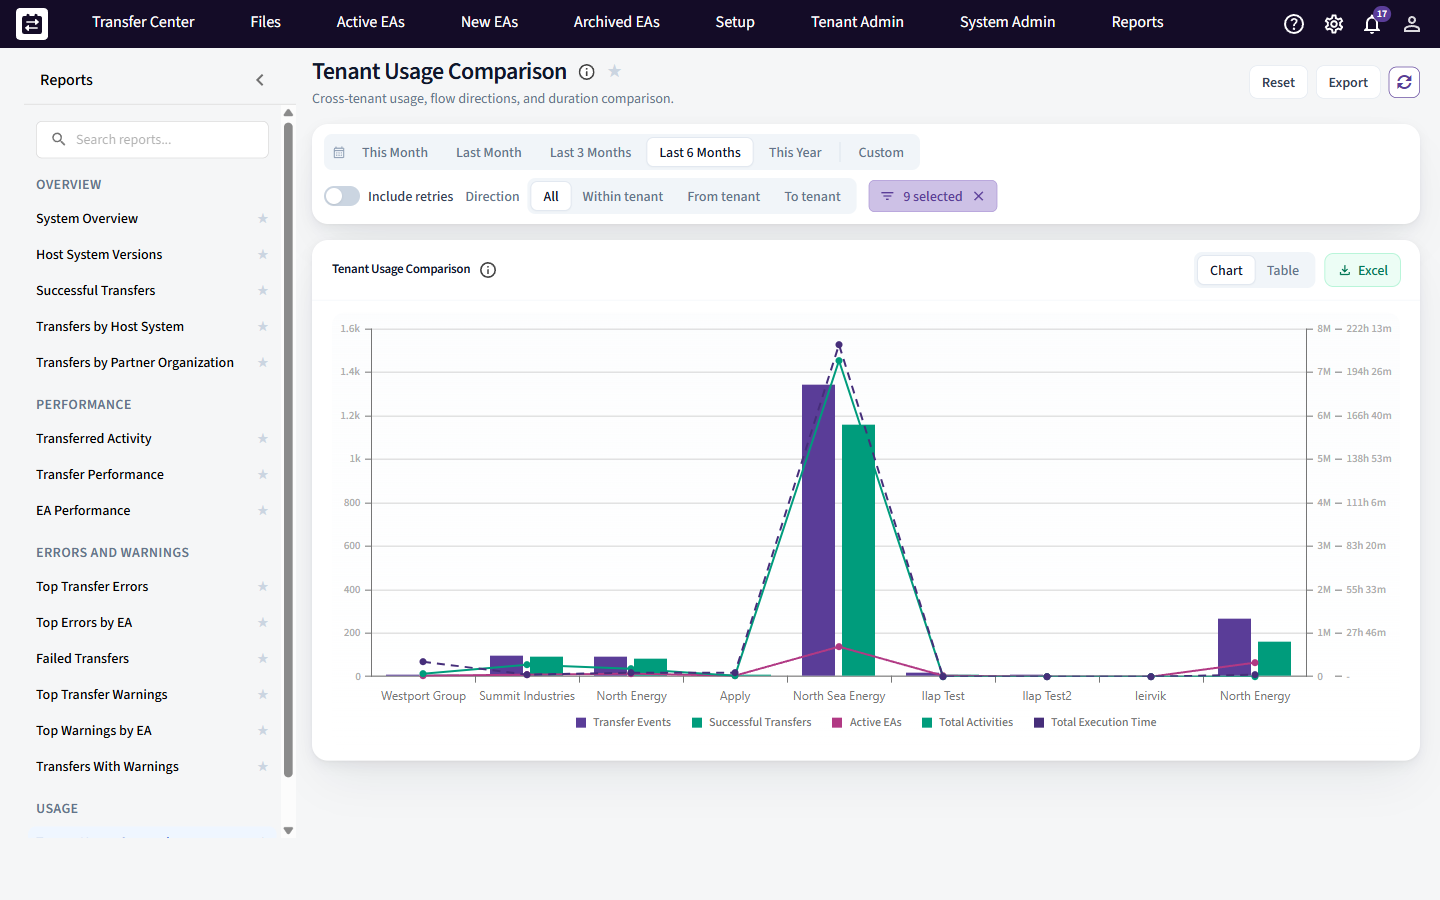
Tenant Usage Comparison: per-tenant volume and execution time, split by whether data stayed within one tenant or crossed between tenants.
- What you see: per tenant — transfer events, successful transfers, total activities and total execution time — plus whether the data stayed Within Same Tenant or crossed to another organization.
- How to read it: compare throughput and processing time across tenants, and see how much of your exchange is internal versus external.
- Filters: date range, flow direction (All / Within Same Tenant / From Tenant to Another / To Tenant from Another), include retries.
Investigating a single transfer
From Failed Transfers (and the error/warning drill-downs) you can open a transfer's diagnostics — the deepest view SchedEx offers for one transfer attempt. It gathers, per attempt:
- the metadata: activity and resource counts, data size, and how long each stage took (host system, Flow API, processor);
- the errors and warnings raised;
- the host system parameters used and the client/component versions;
- and, where available, the underlying call logs.
This is what you quote to support, or use yourself, to pin down exactly where a transfer went wrong.
Related guides
- Reading the Autonomous Component Dashboard — the live operational view (reports are the historical, exportable view).
- Support logs — sending a transfer's logs to the support team.
- Glossary — shared SchedEx terms.
Was this article helpful?
That’s Great!
Thank you for your feedback
Sorry! We couldn't be helpful
Thank you for your feedback
Feedback sent
We appreciate your effort and will try to fix the article